ARTICLE
GRR vs. NRR: The Strategic Guide to SaaS Revenue Retention Metrics in 2026

A 120% NRR might look like a victory, but if your GRR is sliding toward the 88% median, you aren’t scaling; you’re just outrunning a house fire. You likely recognize that relying on Net Revenue Retention as a sole North Star is a risk because expansion revenue often masks underlying churn. This creates a dangerous illusion of product-market fit that collapses the moment expansion slows. Understanding the strategic nuances of grr vs nrr is no longer optional. It’s a requirement for survival in a 2026 market that rewards efficient, sustainable revenue over growth at all costs.
This guide provides a clear framework to master both metrics and identify the specific leaks draining your bottom line. We’ll explore the critical “Delta” between your revenue floor and your business ceiling while providing actionable steps to stabilize your GRR through automated cancellation flows and smart retries. We’re moving beyond definitions to provide the data-driven precision you need to scale your subscription business with absolute confidence. By the end, you will have a sophisticated reporting structure that clearly distinguishes between customer loyalty and temporary expansion gains.
Key Takeaways
- Distinguish between your revenue floor and ceiling by understanding how GRR tracks core product value while NRR measures total expansion potential.
- Identify the “Expansion Mask” where high net retention figures hide dangerously low gross retention, signaling a fragile business model.
- Align your reporting with 2026 benchmarks where elite B2B SaaS performance requires maintaining at least 90% GRR and 120% NRR.
- Master the strategic grr vs nrr distinction to deploy targeted automation like smart retries and cancellation flows that protect your revenue floor.
- Leverage AI feedback analysis to diagnose revenue leaks and implement dynamic offers that secure long-term customer loyalty and improve valuation.
Defining the Pillars: Gross vs. Net Revenue Retention
In the high-velocity SaaS market of 2026, understanding the distinction between grr vs nrr isn’t just about accounting; it’s about diagnostic accuracy. Gross Revenue Retention (GRR) acts as your defensive line. It measures your ability to keep the revenue you’ve already won without the distraction of upsells. Conversely, Net Revenue Retention (NRR) is your offensive engine. It captures the total health of your account base, including expansion revenue. While NRR tells you how much your business can grow, GRR tells you if your product actually solves the problem it claims to fix.
Modern investors have shifted their scrutiny. The “growth at all costs” era ended; the focus is now on sustainable customer retention. High NRR can be bought through aggressive sales tactics or price hikes, but a strong GRR is earned through product value. If your GRR is healthy, it proves you’ve found true product-market fit. In 2026, a company with a high NRR but a failing GRR is viewed as a high-risk asset because expansion revenue cannot indefinitely mask a leaky bucket.
Calculating Gross Revenue Retention (GRR)
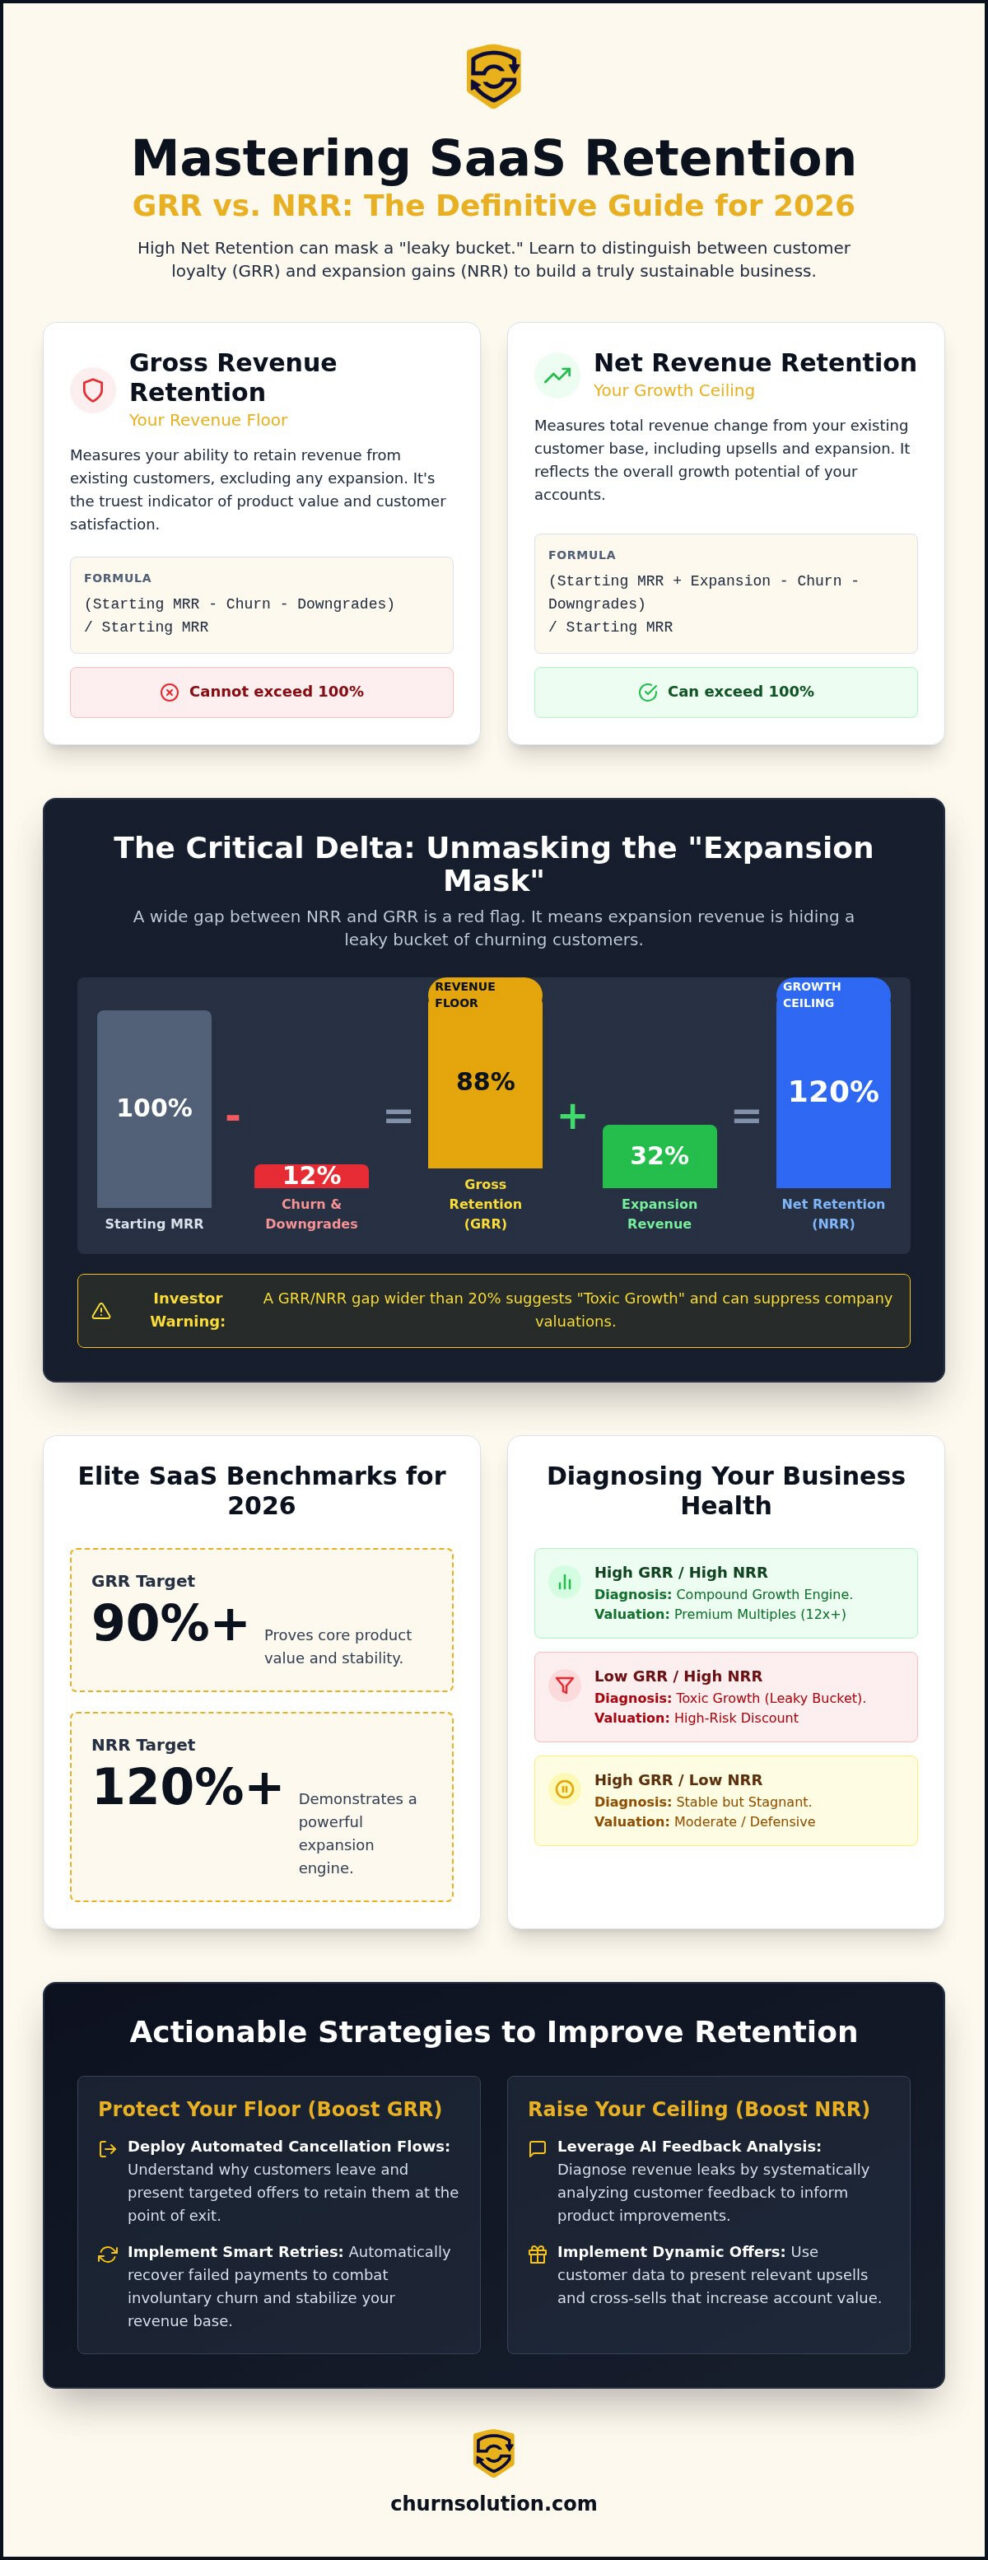
To calculate GRR, use this formula: (Starting MRR – Churn – Downgrades) / Starting MRR. The most critical rule here is that expansion revenue, cross-sells, and upsells are strictly excluded. GRR can never exceed 100%. A declining GRR is a red alert. It indicates that your core product value is eroding or that you are losing customers to competitors. Even if your top-line revenue is growing, a GRR below the 88% median suggests your foundation is unstable. You are losing the very customers you spent significant capital to acquire.
Calculating Net Revenue Retention (NRR)
NRR provides the full picture of your revenue lifecycle. The formula is: (Starting MRR + Expansion – Churn – Downgrades) / Starting MRR. This metric allows for “negative churn,” where the revenue gained from existing customers through upgrades outweighs the revenue lost through cancellations. It is the ultimate measure of your business’s ceiling. Best-in-class companies aim for 120% or higher. You can track these vital signals in real-time using Churn Metrics to ensure your expansion isn’t just a temporary patch. By monitoring grr vs nrr side-by-side, you gain the clarity needed to determine whether your growth is coming from new value or simply squeezing more from a shrinking base.
The Critical Delta: Why the Gap Between GRR and NRR Matters
The numerical difference between your Gross Revenue Retention and Net Revenue Retention is the most honest diagnostic of your business health. In the industry, we call a large delta the “Expansion Mask.” This occurs when a company uses aggressive upsells or price increases to cover up a core product that users are actively abandoning. If you see a gap wider than 20%, your sales team is likely over-promising to a customer base that the product cannot satisfy. This misalignment is a primary driver of suppressed SaaS company valuations. Investors in 2026 aren’t just looking at the top-line NRR; they are dissecting the grr vs nrr spread to find signs of “toxic growth.”
Scenario A represents the “Stable but Stagnant” model. Here, you have High GRR but Low NRR. Your customers love the product and they don’t leave, but you lack the mechanism to expand accounts. While safe, this model rarely achieves the 11.7x revenue multiples seen by top-tier performers. Scenario B is the “Leaky Bucket.” This is characterized by Low GRR and High NRR. You are growing, but you’re burning through your Total Addressable Market (TAM) by churning users and replacing them with high-priced expansion deals. This is unsustainable. Without a strong GRR floor, your expansion ceiling eventually collapses.
Scenario Comparison Table
| Metric Profile | Business Diagnosis | Valuation Impact |
|---|---|---|
| High GRR / High NRR | Compound Growth Engine | Premium Multiples (12x+) |
| Low GRR / High NRR | Toxic Growth (Leaky Bucket) | High Risk Discount |
| High GRR / Low NRR | Stable but Stagnant | Moderate / Defensive |
Identifying Revenue Leaks
Finding the source of these leaks requires more than just looking at a spreadsheet. You need to understand the “why” behind the churn. Utilizing AI Feedback Analysis allows you to categorize revenue loss into “Bad Fit” acquisitions versus “Bad Product” experiences. Often, the numbers tell you that you’re losing money, but Exit Surveys tell you how to stop it. If you want to start visualizing these gaps in your own data, you can create a free account to begin auditing your retention pipeline. Analyzing the grr vs nrr delta is the first step toward moving from reactive churn management to proactive revenue protection.
SaaS Benchmarks: What Good GRR and NRR Look Like in 2026
The standard for excellence has shifted. In 2026, investors no longer accept high expansion revenue as a valid excuse for poor customer retention. Efficiency is the new mandate. Data from July 2026 indicates that private B2B SaaS companies maintain a median Annual NRR of 101% and a median Annual GRR of 88%. However, simply hitting the median is insufficient for those seeking premium valuations. Companies with NRR exceeding 120% currently trade at a median 11.7x EV/TTM revenue multiple, representing a 109% premium over the market average. To achieve these numbers, you must balance the strategic weight of grr vs nrr by protecting your revenue floor while simultaneously driving expansion.
Market volatility has made GRR a more critical signal than ever. While NRR captures the “ceiling” of your growth, GRR reveals the structural integrity of your product. A high GRR proves that your solution is essential, whereas expansion-heavy NRR can be volatile if your customers’ own budgets tighten. In 2026, efficient growth is defined by a GRR that stays above 90% regardless of economic shifts. This stability reduces the pressure on your sales team to constantly find new expansion opportunities just to stay flat.
Enterprise vs. SMB Retention Targets
Retention targets vary significantly by customer segment. Enterprise SaaS companies with an ACV over $100k typically see a median NRR of 118%, while SMB-focused businesses ($5k to $25k ACV) hover around 100% to 102%. In the SMB space, logo churn is the primary metric to watch because acquisition costs are lower but volume is higher. In contrast, Enterprise models are dominated by revenue churn, where losing a single key account can devastate your quarterly goals. The Rule of 40 in 2026 dictates that your combined growth rate and profit margin should exceed 40%, a target that is nearly impossible to hit without a GRR floor of at least 92% for Enterprise or 82% for SMB.
The Role of Involuntary Churn in Benchmarking
Involuntary churn remains the most overlooked obstacle to reaching best-in-class benchmarks. Failed payments and credit card expirations typically account for 20% to 40% of total churn. This is the “low-hanging fruit” of revenue retention. Unlike voluntary churn, which requires product or support interventions, involuntary churn is a technical failure. Implementing sophisticated Payment Recovery strategies allows you to recover this revenue automatically. By fixing the technical leaks that drag down your grr vs nrr, you can immediately boost your baseline metrics without changing a single line of code in your core product.
Operationalizing Retention: How to Move the Needle on Both Metrics
Retention metrics are not static scoreboard tallies; they are operational signals that demand specific technological responses. To move the needle on the grr vs nrr spread, you must shift from manual customer success motions to automated revenue protection. This involves a two-pronged strategy: stabilizing your revenue floor by preventing voluntary cancellations and expanding your ceiling through technical recovery and smart account growth. If you treat these numbers as financial history rather than active levers, you’re missing the opportunity to intervene before revenue actually leaves your bank account.
Stop the bleed by focusing on the point of exit. Recover the lost by fixing technical failures in your billing stack. Expand the base by turning every cancellation attempt into a negotiation. Finally, reactivate the lapsed through automated win-back campaigns that target high-value former users. This methodical approach ensures that your retention strategy is a high-performance engine rather than a reactive department.
Stabilizing GRR with Automated Cancellation Flows
Voluntary churn is often a reaction to a temporary friction point rather than a total loss of product value. By deploying Dynamic Offers at the precise moment a user clicks “cancel,” you can intercept and save 15% to 30% of those users. This mechanism works by offering alternatives tailored to the user’s specific feedback, such as a targeted discount or a plan downgrade. It shifts the conversation from “goodbye” to “let’s adjust.”
The psychology of the “pause” button is a critical component of this flow. It allows a customer to stop billing without the finality of a cancellation, preserving the data and configuration that makes returning a seamless experience. This subtle shift in the user journey protects your GRR by converting a potential churn event into a temporary hiatus. For a deeper dive into these strategies, read our guide on 5 best practices to optimize your cancellation flow.
Boosting NRR through Smart Recovery and Expansion
NRR growth depends on your ability to keep expansion revenue flowing without technical interruptions. Involuntary churn from failed payments is a silent killer of NRR. Using Smart Retries, you can recover up to 40% of failed payments by timing retry attempts based on bank processing patterns and historical data. This ensures that your expansion efforts aren’t undermined by avoidable administrative declines. Every recovered payment is a direct contribution to your revenue ceiling.
Once the technical floor is secure, expansion becomes a matter of precision. Use Customer Segmentation to identify which users are hitting usage limits or showing high engagement scores. By targeting these segments with automated expansion offers, you increase the “Net” in your NRR without the high cost of new customer acquisition. Balancing the operational levers of grr vs nrr ensures that every dollar saved is a dollar that can eventually be expanded through increased usage or upsells.
Future-Proofing Your Revenue with Churn Solution
Manual retention efforts are a liability in a high-volume SaaS environment. Relying on customer success managers to manually intervene with every at-risk account is slow, expensive, and impossible to scale. In the 2026 market, your competitors are using automation to protect their margins while you struggle with spreadsheets. To effectively manage the tension of grr vs nrr, you need a system that operates at the speed of your billing engine. Churn Solution provides this infrastructure by turning passive retention data into immediate, automated actions that preserve your MRR.
The core advantage of our platform lies in the integration of specialized tools. We don’t just report on churn; we stop it. By combining dunning email automation, intelligent cancellation flows, and AI feedback analysis, we create a defensive perimeter around your existing revenue. This data-driven approach ensures that every customer exit is either intercepted or analyzed for future prevention. You move from guessing why users leave to knowing exactly how to keep them.
The Revenue Protection Ecosystem
Our platform is designed to address the two distinct types of revenue loss discussed throughout this guide. For involuntary churn, we utilize smart retries and dunning sequences to recover failed payments without human intervention. For voluntary churn, our automated cancellation flows deploy dynamic offers that pivot users from total cancellation to plan pauses or downgrades. This dual-action approach stabilizes your GRR floor while protecting the expansion potential that drives your NRR.
Implementation is seamless. Churn Solution integrates directly with your existing billing engines, such as Stripe, allowing you to go live in minutes rather than months. This connectivity ensures that your billing data and retention efforts are always in sync. To see how these pieces fit into a broader strategy, consult our Subscription Revenue Protection: The 2026 Guide for a deep dive into automated retention architecture.
Taking the Next Step
The ROI of automated revenue protection is immediate. When smart retries recover up to 40% of failed payments, the system pays for itself within the first billing cycle. You aren’t just buying software; you’re installing a revenue recovery engine that works 24/7 to secure your business’s future. Retention is no longer a department or a secondary task for your support team. It is a data-driven process that requires technical mastery and precision.
Stop letting revenue leak through avoidable technical failures and unoptimized exit paths. By mastering the operational balance of grr vs nrr, you position your company for the premium valuation multiples that 2026 investors demand. Ready to see the impact on your own metrics? Book a demo today to audit your current retention pipeline and start protecting your MRR with the industry’s most sophisticated automation suite.
Master Your Revenue Floor and Ceiling
Success in the 2026 SaaS market requires more than just monitoring a spreadsheet; it demands an active defense of your revenue floor. You now understand that the strategic balance of grr vs nrr is the ultimate indicator of whether your growth is sustainable or merely a temporary mask for underlying churn. By focusing on the delta between these metrics, you can identify precisely where your product value ends and where your sales expansion begins. This clarity is what separates elite performers from stagnant businesses.
Operationalizing this data through AI-powered feedback analysis and automated payment recovery ensures that no dollar is lost to technical failure or avoidable friction. Implementing dynamic cancellation offers allows you to intercept voluntary churn at the point of exit, turning a potential loss into a retention victory. You have the framework to move beyond passive reporting and into high-performance revenue protection. It’s time to stop guessing why revenue is leaving and start deploying the tools that keep it.
Take control of your subscription health and build a business that investors value for its structural integrity. Your path to efficient, data-driven scaling starts with a single automated intervention.
Frequently Asked Questions
Is a high NRR always better than a high GRR?
High NRR is not inherently superior because it can camouflage a failing product. While NRR measures total growth, GRR measures structural stability. A business with 120% NRR but only 70% GRR is a leaky bucket that relies on unsustainable expansion to survive. You must prioritize a strong GRR to ensure your core value proposition actually retains the customers you acquire.
Can GRR ever be higher than NRR?
GRR can technically be higher than NRR if your expansion revenue is zero and you have significant downgrades. However, since GRR excludes expansion by definition, NRR is almost always higher in healthy, growing companies. If your NRR falls below your GRR, it signals that your existing customers are shrinking their accounts or leaving faster than you can grow them.
How often should a SaaS company calculate GRR vs. NRR?
Calculate both metrics monthly to maintain a real-time pulse on business health. Operational teams need monthly data to identify immediate revenue leaks or successful expansion campaigns. Board-level reporting typically focuses on quarterly trends to smooth out month-to-month volatility. Consistent tracking of grr vs nrr allows you to spot dangerous deltas before they impact your valuation.
What happens if my NRR is over 100% but my GRR is under 80%?
This scenario indicates toxic growth where aggressive expansion revenue masks a high rate of customer dissatisfaction. You are essentially burning through your addressable market to maintain top-line growth. Investors view this as high-risk. Once expansion opportunities within your current base are exhausted, your total revenue will collapse because your retention floor is too low to support the business.
How do failed credit card payments affect my NRR calculation?
Failed payments directly reduce your NRR by increasing involuntary churn. Since NRR includes all recurring revenue changes from your existing base, every technical decline is a lost dollar that drags down your percentage. Recovering these payments through smart retries is the most efficient way to boost your net retention without requiring any additional sales effort or marketing spend.
Can automated cancellation flows actually improve my GRR?
Automated cancellation flows improve GRR by intercepting voluntary churn at the point of exit. By offering dynamic alternatives like account pauses or targeted discounts, you keep the customer within your revenue base. These interventions save between 15% and 30% of users who would otherwise be a total loss, which directly stabilizes your gross retention floor and protects your MRR.
What is a ‘good’ NRR for a seed-stage SaaS company in 2026?
A seed-stage company should aim for an NRR of at least 100% as a baseline for survival. In the 2026 market, best-in-class startups strive for 120% or higher to prove scalability to future investors. While early-stage data is often volatile, achieving high net retention early demonstrates that your product creates enough value to justify expansion and upsells within your initial cohort.
How do I explain the difference between GRR and NRR to my board?
Explain that GRR represents your revenue floor while NRR represents your revenue ceiling. Tell your board that GRR is the purest measure of product-market fit because it ignores upsells and focuses solely on retention. NRR shows the total economic value of your customer base. Highlighting the delta between grr vs nrr helps the board understand if growth is driven by product loyalty or sales expansion.
- Key Takeaways
- Table of Contents
- Defining the Pillars: Gross vs. Net Revenue Retention
- The Critical Delta: Why the Gap Between GRR and NRR Matters
- SaaS Benchmarks: What Good GRR and NRR Look Like in 2026
- Operationalizing Retention: How to Move the Needle on Both Metrics
- Future-Proofing Your Revenue with Churn Solution
- Master Your Revenue Floor and Ceiling
- Frequently Asked Questions

Churn solution that turns your customers right around.
Related Articles
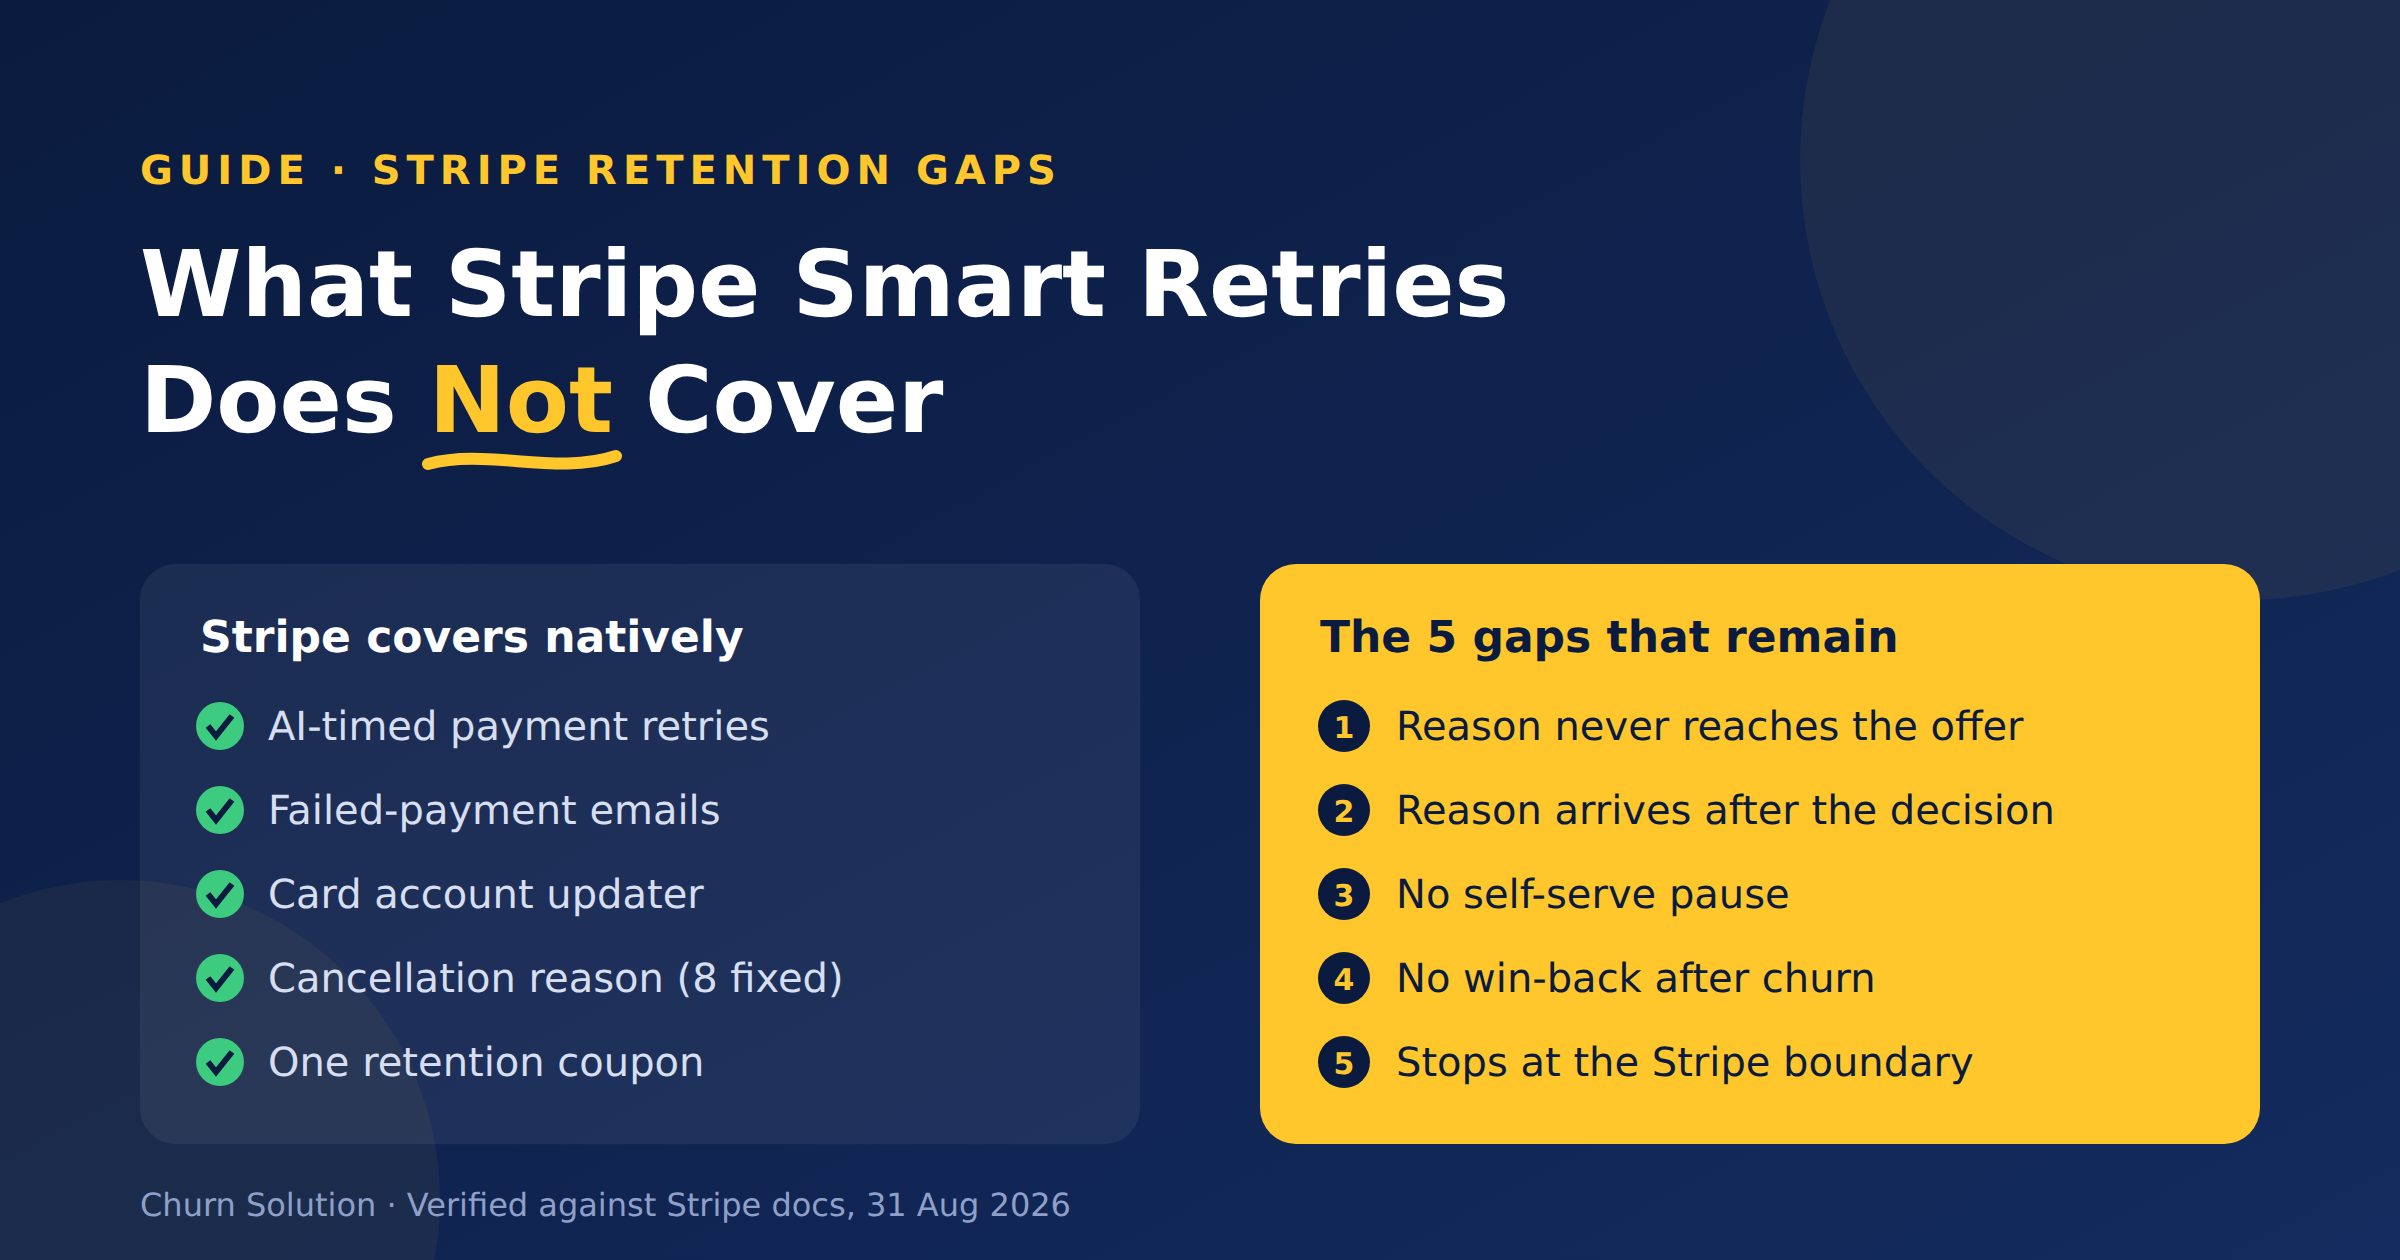
What Stripe Smart Retries Does Not Cover
Stripe Smart Retries recovers failed payments but doesn't run retention. Here are the five gaps that remain, sourced from Stripe's...


Membership Community Churn: The Members Who Quit Without Clicking Cancel
Quiet churn is the real leak: members who never clicked “cancel” at all. A card expires. A bank declines a...


Subscription Churn Dashboard: The 2026 Guide to Actionable Revenue Intelligence
Up to 40% of subscription churn is involuntary, meaning your customers aren't choosing to leave; they're being forced out by...