ARTICLE
Calculating the Cost of Involuntary Churn: The 2026 Revenue Recovery Guide

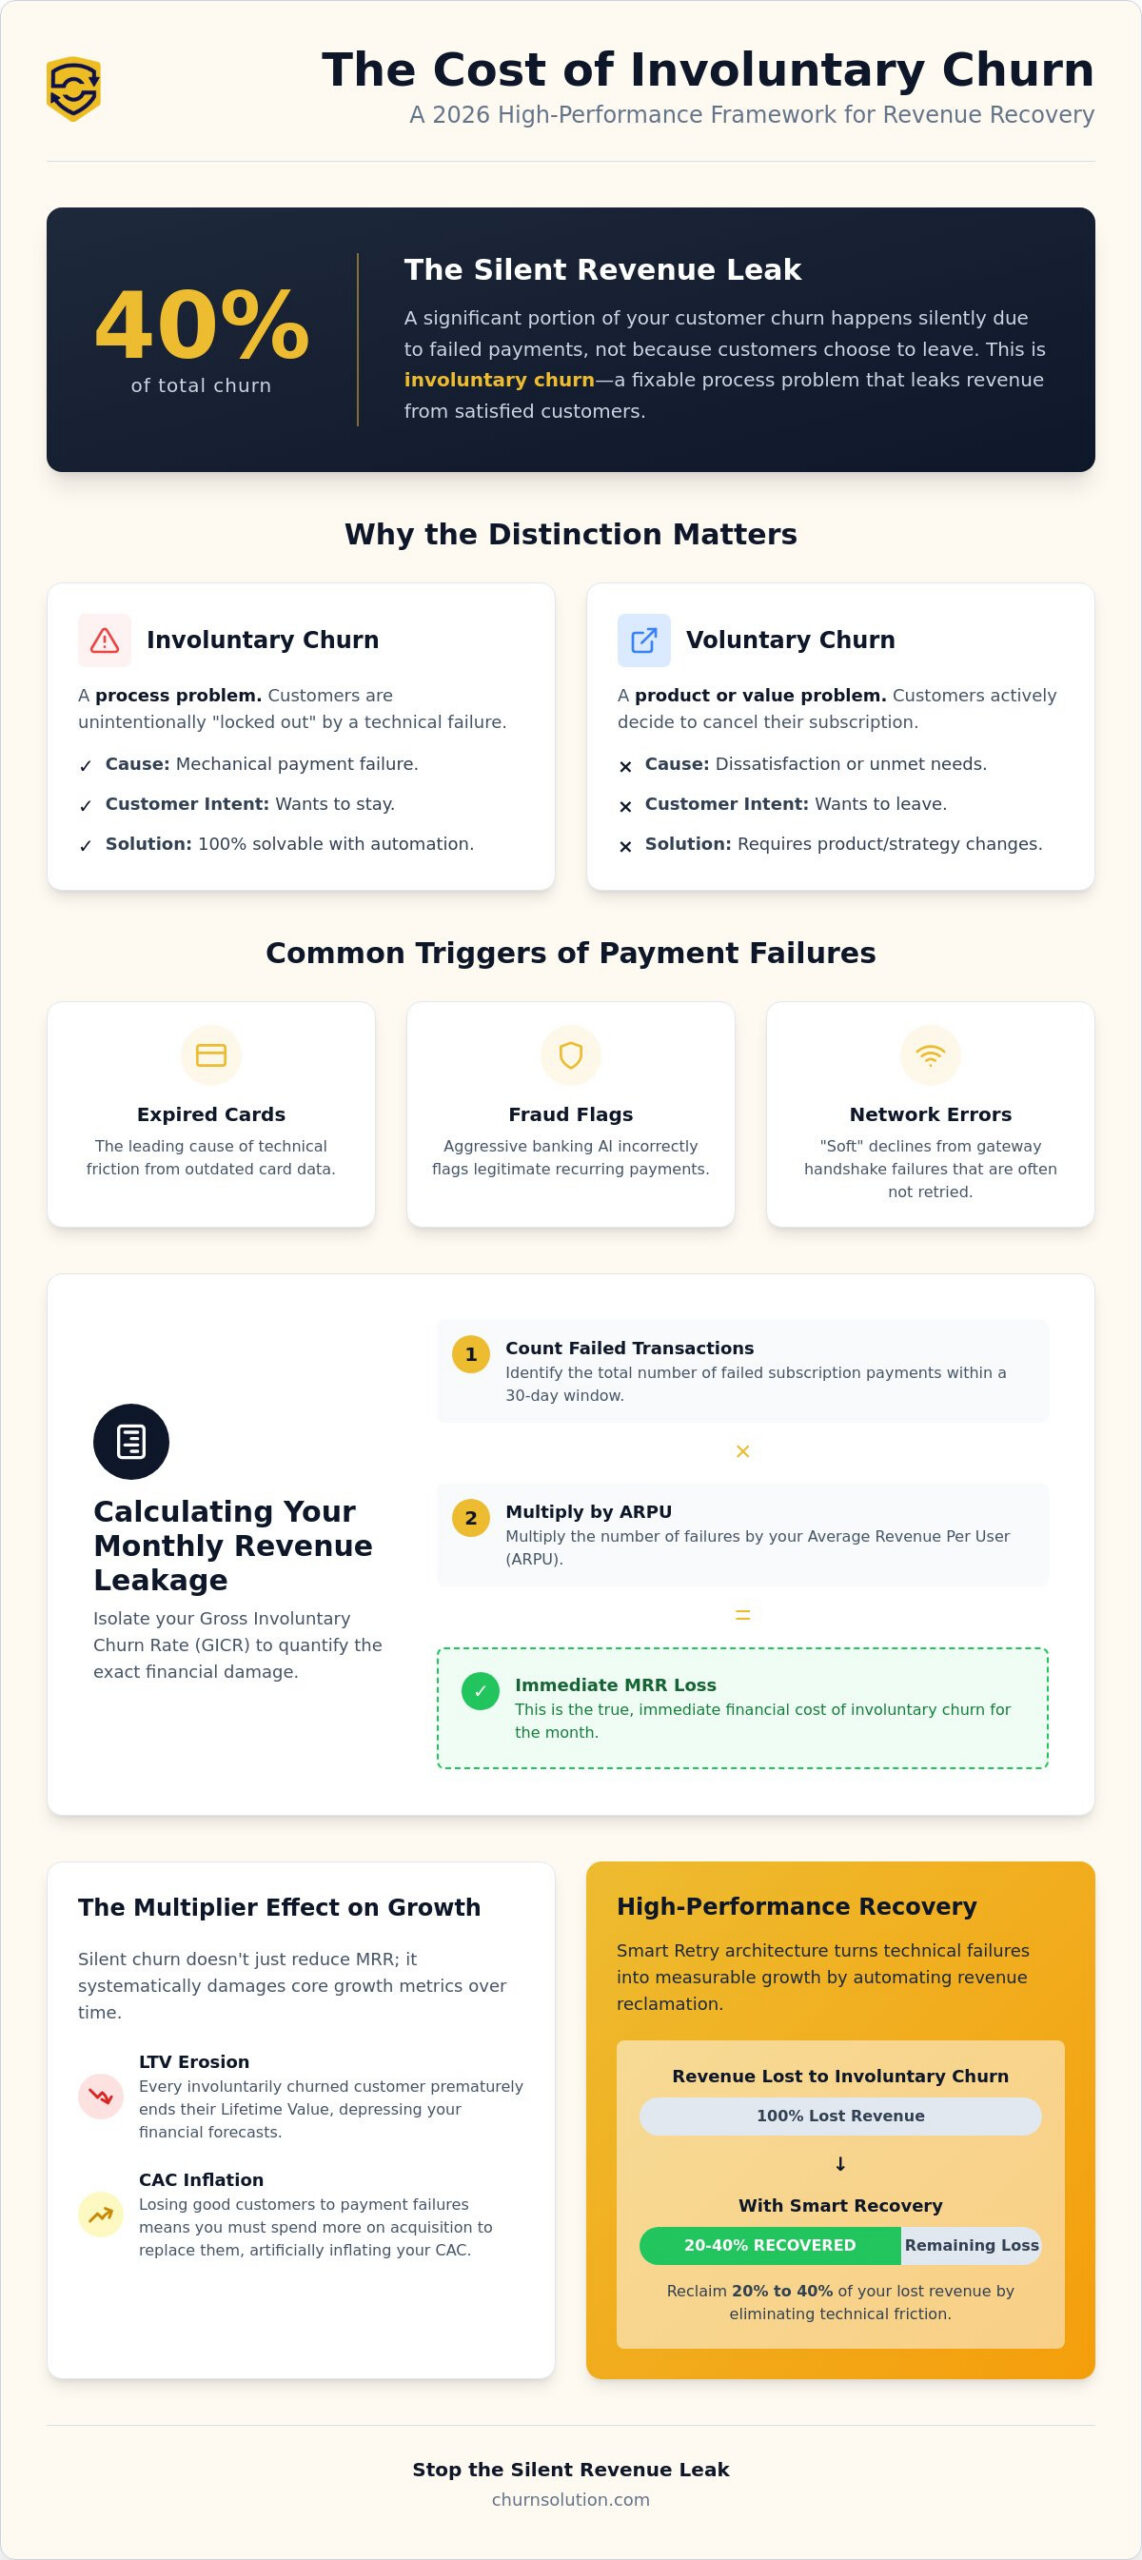
Forty percent of your total customer churn is likely happening without your users ever making a conscious decision to leave. This silent revenue leakage destroys your LTV-to-CAC ratio and forces your engineering team to waste precious resources on custom dunning logic that often fails to scale. You’ve likely felt the frustration of watching hard-won customers disappear simply because of an expired card or a temporary network glitch.
You understand that every failed payment is a lost relationship, yet quantifying the exact damage remains a persistent challenge for most growth teams. This 2026 guide changes that by providing a high-performance framework for calculating the cost of involuntary churn and implementing a sophisticated recovery strategy. You’ll master the precise financial formulas needed to justify a retention software investment and see how smart retries can reclaim 20% to 40% of your lost revenue. We’re moving beyond basic gateway dunning to a data-driven ecosystem that turns technical failures into measurable growth opportunities.
Key Takeaways
- Distinguish between technical and financial payment failures to prioritize high-yield recovery efforts within your subscriber base.
- Establish a definitive financial baseline by calculating the cost of involuntary churn using Gross Involuntary Churn Rate (GICR) and immediate MRR loss formulas.
- Quantify the multiplier effect of silent churn on critical performance metrics, specifically focusing on LTV erosion and artificial CAC inflation.
- Benchmark your recovery performance against 2026 industry standards for B2B SaaS and consumer subscriptions to identify competitive gaps.
- Deploy a high-performance recovery architecture that utilizes Smart Retries to automate revenue reclamation and eliminate technical friction.
Understanding Involuntary Churn: The Silent Revenue Leak
Involuntary churn is the silent killer of subscription growth. It occurs when an active, satisfied customer unintentionally loses access to your service because of a failed transaction. Unlike voluntary churn, where a user actively cancels their subscription, this is a mechanical failure within the payment lifecycle. You are losing revenue from people who still want your product. This distinction is critical when calculating the cost of involuntary churn because these customers have zero intention of leaving. They are simply victims of a broken technical handshake.
Payment failures generally fall into two categories: technical and financial. Technical declines happen when card data is outdated, such as an expired expiration date or a reissued card number. Financial declines occur when a bank rejects a transaction due to insufficient funds or credit limits. In both scenarios, the customer remains “locked out” of the value they’ve grown to rely on, often without receiving a clear notification from their bank. This creates a friction point that most customers won’t bother to fix on their own.
The 2026 landscape has introduced new layers of friction. Global payment regulations like PSD3 and expanded Strong Customer Authentication (SCA) requirements have increased the complexity of cross-border transactions. These mandates, while designed to reduce fraud, often trigger aggressive banking algorithms that flag legitimate recurring payments as suspicious. This regulatory shift is driving higher decline rates across the subscription economy, making automated recovery a necessity rather than a luxury.
Involuntary vs. Voluntary Churn: Why the Distinction Matters
Voluntary churn is a product or value problem. It signals that your offering no longer meets the user’s needs. In contrast, involuntary churn is a process problem. It is a technical hurdle that sits between your revenue and your customer. Broadly categorizing all losses as customer attrition obscures the fact that process problems are 100% solvable through automation. Voluntary churners are “lost” to competitors or apathy; involuntary churners are simply “locked out” by a system error. If you don’t separate these metrics in your churn analysis, you’ll misdiagnose the health of your business.
Common Triggers of Payment Failures in 2026
Why do payments fail in 2026? The triggers are often mundane but compounding. Expired credit and debit cards remain the leading cause of technical friction. False positive fraud flags from hyper-aggressive banking AI frequently block valid recurring charges, especially for high-growth SaaS companies with international footprints. Network errors during the payment gateway handshake can cause “soft” declines that never get retried without the right logic. Verified industry data confirms that involuntary churn accounts for 20-40% of total customer churn. This represents a massive, recoverable segment of your recurring revenue that requires a specialized technical remedy.
Calculating the True Cost: A Step-by-Step Financial Formula
Stop treating churn as a single, monolithic percentage. To master your revenue health, you must isolate the Gross Involuntary Churn Rate (GICR). This baseline represents the percentage of your total subscriber base lost specifically to failed transactions. When calculating the cost of involuntary churn, start with the immediate Monthly Recurring Revenue (MRR) loss. The formula is simple: multiply the number of failed payments by your Average Revenue Per User (ARPU). However, this figure is often inflated by accidental self-recoveries. You must subtract these to find your true leakage.
Classic research from Bain & Company highlights that increasing retention rates by 5% increases profits by 25% to 95%. In the context of involuntary churn, this profit lift is even more accessible. The retention doesn’t require a product overhaul; it only requires a functional payment bridge. When you apply this monthly leakage figure to a 12-month projection, the compounding effect reveals a devastating impact on your annual recurring revenue (ARR) that often exceeds your quarterly growth targets.
The Formula for Monthly Revenue Leakage
Quantify your loss by following these three steps:
- Step 1: Identify the total number of failed transactions in a 30-day window. Do not include pending retries yet.
- Step 2: Multiply that number by your ARPU to find the gross potential loss.
- Step 3: Subtract the revenue successfully recovered via basic gateway dunning or customer-initiated updates.
The remaining balance is your actual revenue leak. If you want to see these metrics in real-time, you can start auditing your failed payments today.
Soft vs. Hard Declines: Refining Your Projections
Refining your calculation requires distinguishing between Soft and Hard declines. Soft declines are temporary issues like insufficient funds or network timeouts. Hard declines involve permanent failures such as stolen cards or closed accounts. Most legacy systems treat these identical, but your financial model shouldn’t. This precision is vital when calculating the cost of involuntary churn to ensure your financial models reflect reality.
Weight your projections by assigning a high recovery probability to soft declines and a minimal probability to hard declines. Recoverable Revenue is the portion of churn addressable through smart retries. By isolating this segment using advanced churn metrics, you can justify the ROI of a recovery tool based on actual winnable dollars rather than theoretical totals. This granular approach prevents you from overestimating the ROI of your recovery efforts while identifying the exact dollar value trapped in technical friction.
The Multiplier Effect: Quantifying Indirect Costs and LTV Erosion
The financial damage of payment failures extends far beyond the immediate MRR loss identified in the previous section. It triggers a cascading failure across your unit economics. When calculating the cost of involuntary churn, you must account for the compounding erosion of Customer Lifetime Value (LTV) and the artificial inflation of your Customer Acquisition Cost (CAC). A user who should have stayed for 36 months but drops off at month three due to a technical glitch represents a collapsed ROI. This isn’t just a missed payment. It’s the evaporation of future cash flows you’ve already paid to secure. Use specialized churn metrics to track these secondary impacts before they undermine your company valuation.
Involuntary churn creates a “Re-acquisition Penalty.” This is the redundant cost of marketing to a user who already demonstrated product-market fit but was forcibly removed by a payment gateway. You’re effectively paying twice for the same customer. This inefficiency strangles your growth margins and forces your team into a defensive posture. Instead of investing in market expansion, you’re diverted into a cycle of “filling the leaky bucket” to maintain a flat baseline.
Wasted CAC: The Price of Replacing “Ghost” Customers
Calculate your wasted CAC by multiplying your average acquisition cost by the total number of involuntary churners. The result is often staggering. Replacing a churned user is five times more expensive than retaining an existing one. Every dollar redirected to replace a “ghost” customer is a dollar stolen from your innovation budget. This creates a massive opportunity cost. If your CAC is $500 and you lose 100 customers to silent payment failures, you’ve just incinerated $50,000 in marketing efficiency. High-performance growth teams recognize that reclaiming these users through automation is the most cost-effective acquisition strategy available.
Operational Overhead: The Hidden Cost of Manual Recovery
The drain on human capital is a significant, yet often uncounted, expense. Support and Finance teams frequently waste hundreds of hours manually emailing customers about failed cards or processing “Bad Debt” write-offs. These write-offs occur when services are rendered before the transaction failure is detected. This is pure loss. Beyond the balance sheet, consider the brand damage. Abrupt service interruptions for loyal users create a negative feedback loop. A customer who loved your tool may feel insulted by a “payment failed” lockout, leading them to seek a competitor. This friction turns a technical error into a permanent loss of brand equity.
Benchmarking: What Does “Good” Look Like for Your Industry?
Comparing your performance against industry standards is essential for identifying whether your payment failures are a minor friction point or a systemic threat. Context is everything. A 2.0% involuntary churn rate might be acceptable for a high-volume B2C app, but it signals a catastrophic failure for an enterprise B2B platform. Benchmarking is fundamental to calculating the cost of involuntary churn accurately, as it defines your realistic recovery potential and informs your resource allocation.
- Top Performing Companies (All Segments): Below 0.5% of MRR
- B2B SaaS Average: 0.3% to 1.0% of MRR
- Consumer-Facing (B2C) SaaS: 1.0% to 3.0% of MRR
- E-commerce Subscriptions: 2.0% to 4.0% of MRR
High-ticket B2B items typically enjoy lower involuntary churn because corporate credit cards offer greater stability and higher credit limits than individual consumer accounts. However, the stakes are higher. Losing a single enterprise account due to an expired card has a far more damaging impact on your Net Revenue Retention (NRR) than losing a dozen consumer accounts. Use customer segmentation to analyze these cohorts separately. If your high-value segments show churn rates mirroring your low-value tiers, your recovery logic is failing to prioritize your most critical revenue streams.
Identifying your “Recovery Potential” is the next step. Verified industry data shows that 20-40% of total churn is involuntary, and a significant portion of that is winnable. If your current systems aren’t recovering at least 50% of your failed transactions, you’re leaving millions on the table. You can audit your recovery potential for free to see exactly how much revenue is currently slipping through your gateway.
B2B vs. B2C: Different Failures, Different Costs
B2C churn is frequently driven by “insufficient funds” declines, which require strategic retry timing to align with common pay cycles. B2B failures are more often technical, stemming from expired corporate cards or outdated billing addresses. The cost impact also shifts with billing frequency. Annual B2B contracts that fail represent a massive, one-time revenue hit, while monthly B2C failures create a slow, compounding bleed. Understanding these nuances is vital when calculating the cost of involuntary churn for your specific business model.
Identifying the “Red Zone”: When Churn Requires Urgent Intervention
If your involuntary churn rate exceeds 3%, you’ve entered the “Red Zone.” At this threshold, manual recovery is no longer viable, and automation becomes a mandatory investment for survival. Failing to address this leak doesn’t just hurt your current MRR; it suppresses your company’s valuation by dragging down your NRR. High-growth firms don’t tolerate silent revenue leakage. They deploy automated systems to ensure that technical failures never dictate their growth trajectory.
Implementing a High-Performance Revenue Recovery Architecture
Calculation is the diagnostic; architecture is the cure. Once you finish calculating the cost of involuntary churn, you must deploy a technological intervention to plug the leak. A high-performance recovery architecture doesn’t rely on generic gateway settings or manual spreadsheets. It uses sophisticated, multi-layered systems to reclaim revenue before the customer even realizes a failure occurred. This proactive stance transforms a potential loss into a seamless continuation of service and protects your hard-earned LTV.
The first line of defense in any serious recovery stack is Smart Retries. These systems bypass the friction of customer outreach by optimizing the technical handshake between your billing engine and the issuing bank. While retries handle technical glitches and network timeouts, Dunning Email Automation manages financial declines through strategic, empathetic communication. To complete the ecosystem, AI Feedback Analysis provides the diagnostic layer, identifying why specific cohorts fail so you can refine your acquisition and billing strategies in real time.
The Logic of Smart Retries and Dunning Cycles
Timing is the most undervalued variable in recovery logic. Retrying a card at 2:00 AM on a Tuesday often results in a different outcome than a 10:00 AM attempt on a Friday, particularly for B2C segments aligned with common payroll cycles. Your “Dunning Waterfall” should move from invisible soft retries to high-urgency, personalized alerts as the failure persists. Centralizing these operations within a dedicated Payment Recovery hub ensures that every failure is met with the optimal recovery sequence, reducing the cognitive load on your internal teams.
Measuring ROI: The Recovery-to-Cost Ratio
Track your success through a dedicated dashboard that highlights “Recovered Revenue” as a primary KPI. This metric provides the ultimate proof of ROI for your retention efforts. When calculating the cost of involuntary churn, remember that a 10% improvement in your recovery rate doesn’t just impact this month. It compounds. Because subscription revenue is recurring, that 10% lift can result in a 30% or greater increase in long-term ARR. You’ve identified the leak and quantified the damage. Now, it’s time to reclaim what your business has already earned. Calculate your potential savings with Churn Solution and turn technical failures into a predictable growth lever.
Turn Silent Revenue Leakage into a Predictable Growth Lever
You now possess the framework to move beyond surface-level metrics and confront the technical failures eroding your bottom line. Stop treating payment failures as an unavoidable cost of doing business. Master your unit economics by calculating the cost of involuntary churn across every customer cohort and using that data to justify a sophisticated recovery stack. High-growth B2B SaaS companies recognize that process-driven churn is a solvable problem that requires an automated, technological remedy rather than manual support intervention.
Control your financial destiny by deploying a system that bridges the gap between failed handshakes and successful renewals. Churn Solution provides a high-performance architecture that features seamless integration with Stripe and major billing engines. Our platform allows you to recover up to 40% of failed payments automatically, ensuring that expired cards and aggressive banking algorithms never dictate your growth trajectory. Reclaim your lost revenue and protect your LTV with the precision your business deserves.
Recover your lost revenue with Churn Solution’s automated dunning tools. Your revenue is waiting; take command of your recovery architecture today.
Revenue Recovery: Frequently Asked Questions
How do you calculate involuntary churn rate?
Calculate your involuntary churn rate by dividing the number of subscribers lost to payment failures by your total subscriber count at the start of the month. This establishes your Gross Involuntary Churn Rate (GICR). When calculating the cost of involuntary churn, you must isolate these technical losses from voluntary cancellations to identify your true recovery potential and avoid misdiagnosing product-market fit issues.
What is a typical involuntary churn rate for SaaS?
Typical rates vary significantly by market segment. B2B SaaS companies usually see rates between 0.3% and 1.0% of monthly recurring revenue. Consumer-facing SaaS businesses experience higher volatility, ranging from 1.0% to 3.0% of MRR. Top-performing organizations across all industries maintain this metric below 0.5% through automated recovery and sophisticated retry logic.
What is the main cause of involuntary churn?
Payment failures are the primary driver, specifically expired credit cards and insufficient funds. In 2026, we also see an increase in false positive fraud flags from aggressive banking algorithms and network errors during the gateway handshake. These “soft” declines represent the majority of recoverable revenue if addressed with the right technical intervention.
Can involuntary churn be completely eliminated?
Total elimination is impossible because hard declines, such as stolen cards or closed bank accounts, are permanent technical dead ends. However, you can reduce the impact by 20% to 40% by targeting soft declines. High-performance systems focus on recovering every winnable dollar through intelligent automation rather than chasing unrecoverable hard failures that require a new payment method.
What is the difference between dunning and smart retries?
Smart retries are invisible, technical attempts to process a payment without customer involvement by optimizing the timing of the request. Dunning is the customer-facing communication layer, involving automated emails or SMS alerts. Smart retries should always be your first line of defense to minimize friction, followed by a strategic dunning waterfall for failures that require user action.
How does involuntary churn affect LTV-to-CAC ratios?
It destroys the ratio by artificially shortening the customer lifespan and wasting the acquisition cost already spent. When you’re calculating the cost of involuntary churn, you’ll find that losing a customer in month three instead of month thirty-six evaporates your projected LTV. This inefficiency forces you to spend more on CAC just to maintain a flat revenue baseline.
Is Stripe’s built-in dunning enough for a scaling SaaS?
Basic gateway dunning is often insufficient for scaling companies that require granular control and higher recovery rates. Standard tools lack AI-driven retry timing and sophisticated segmentation. Specialized recovery software provides a higher ROI by using machine learning to optimize retry schedules and personalizing communication based on specific decline codes rather than a one-size-fits-all approach.
What happens to customers who churn involuntarily?
These customers become “locked out” of your service, often without realizing their payment failed. This friction creates an immediate re-acquisition penalty and damages your brand equity. If you don’t recover them quickly through automated systems, they likely won’t return on their own and may move to a competitor out of frustration or perceived service instability.
- Key Takeaways
- Table of Contents
- Understanding Involuntary Churn: The Silent Revenue Leak
- Calculating the True Cost: A Step-by-Step Financial Formula
- The Multiplier Effect: Quantifying Indirect Costs and LTV Erosion
- Benchmarking: What Does "Good" Look Like for Your Industry?
- Implementing a High-Performance Revenue Recovery Architecture
- Turn Silent Revenue Leakage into a Predictable Growth Lever
- Revenue Recovery: Frequently Asked Questions

Churn solution that turns your customers right around.
Related Articles
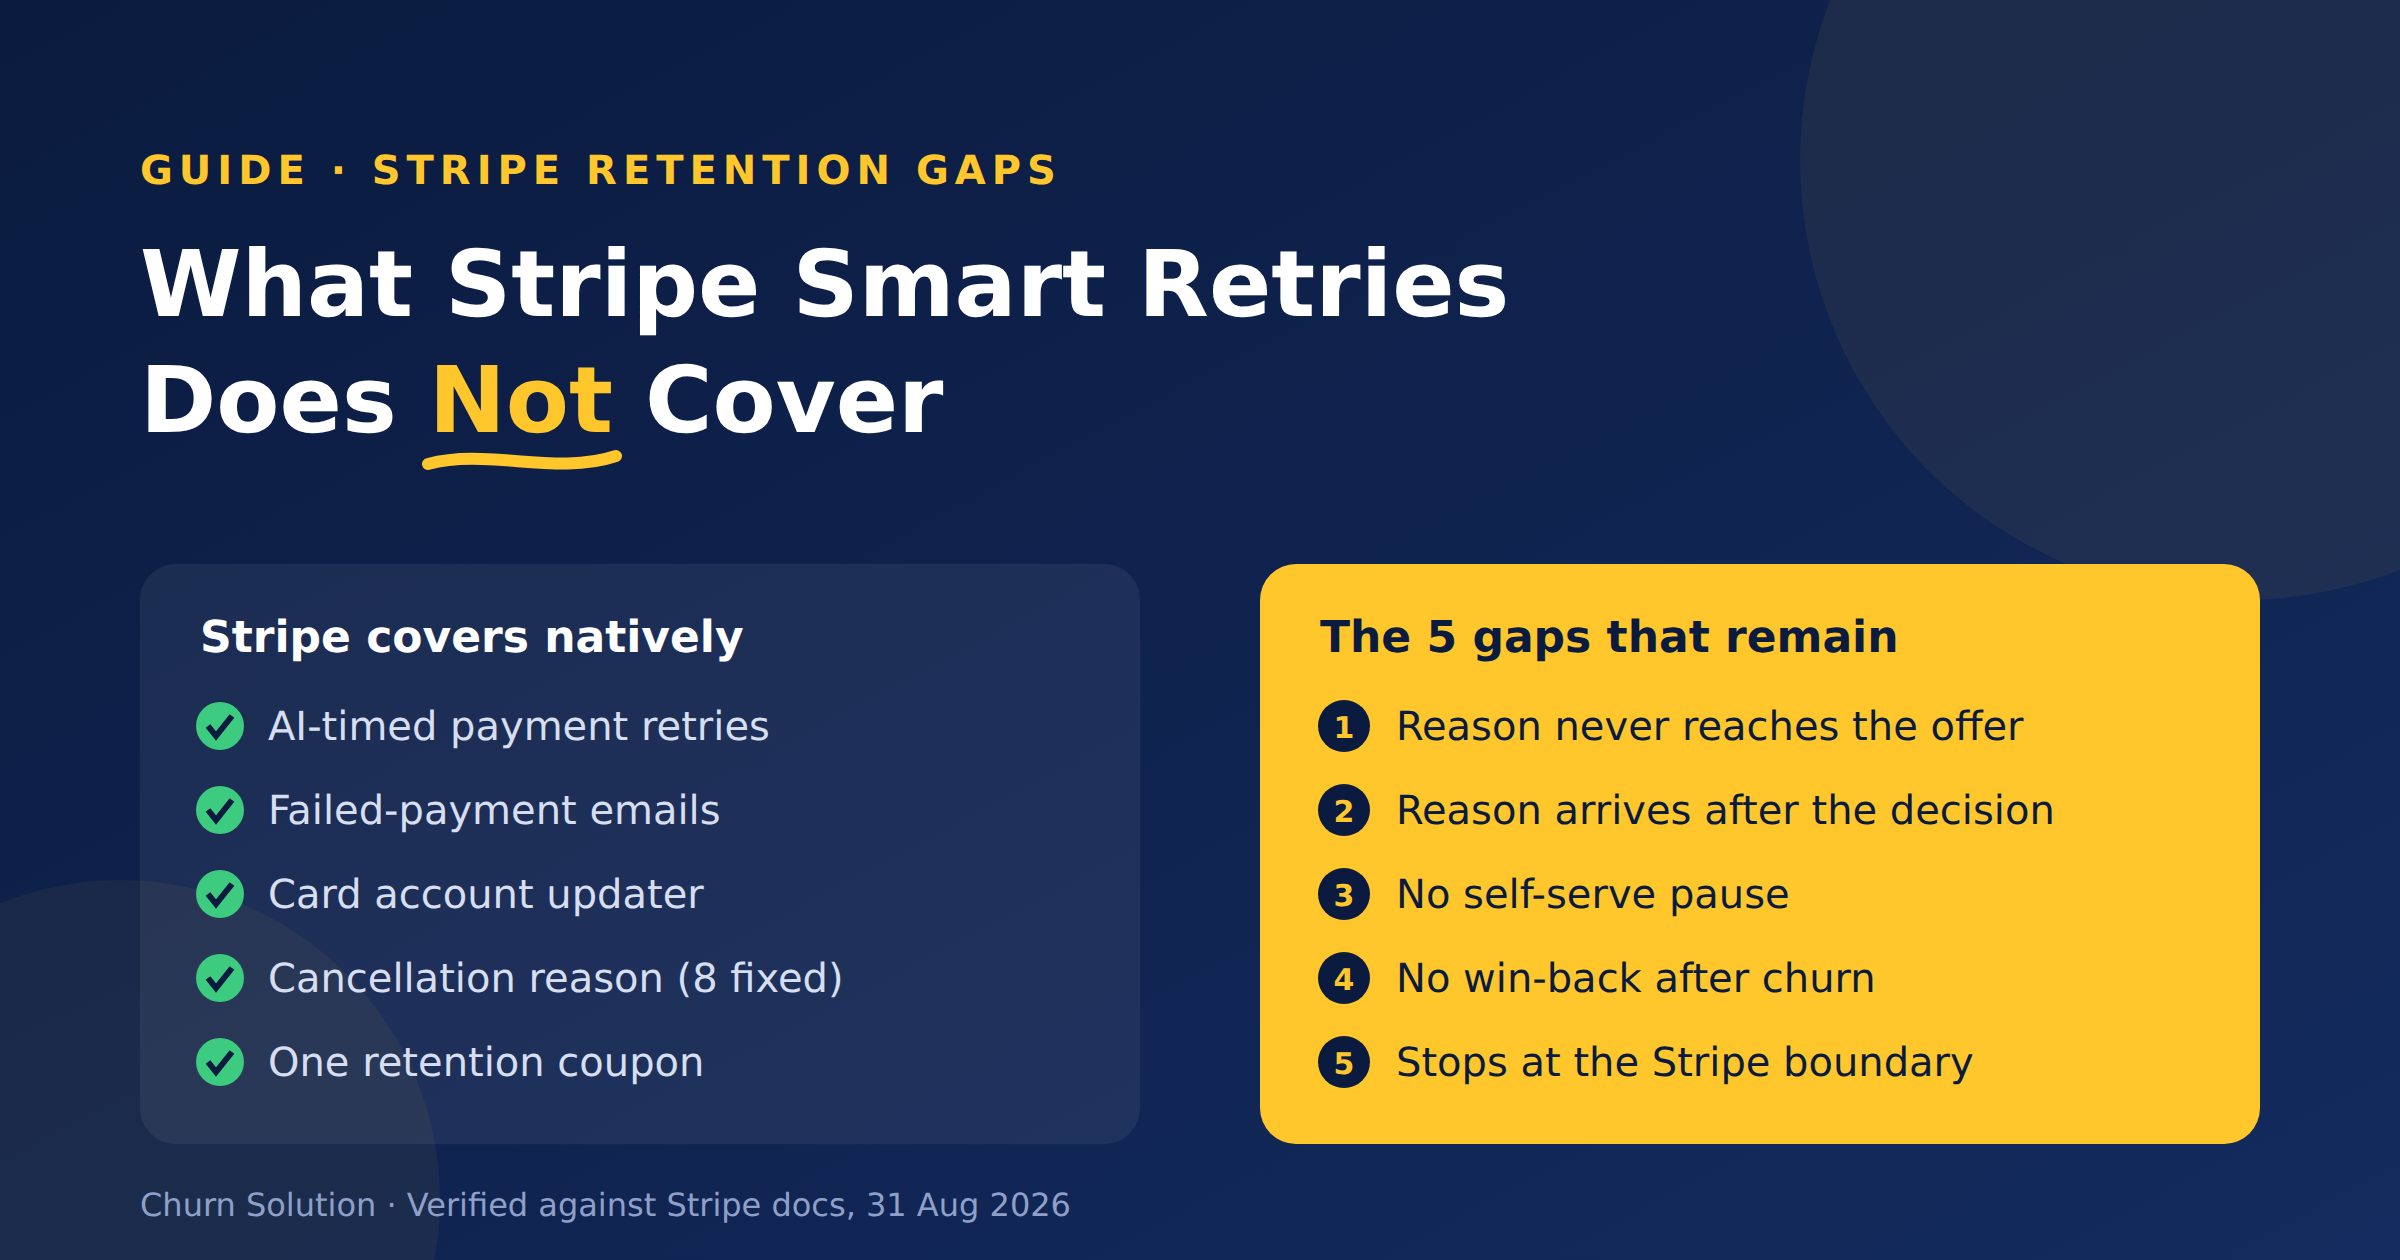
What Stripe Smart Retries Does Not Cover
Stripe Smart Retries recovers failed payments but doesn't run retention. Here are the five gaps that remain, sourced from Stripe's...


Membership Community Churn: The Members Who Quit Without Clicking Cancel
Quiet churn is the real leak: members who never clicked “cancel” at all. A card expires. A bank declines a...

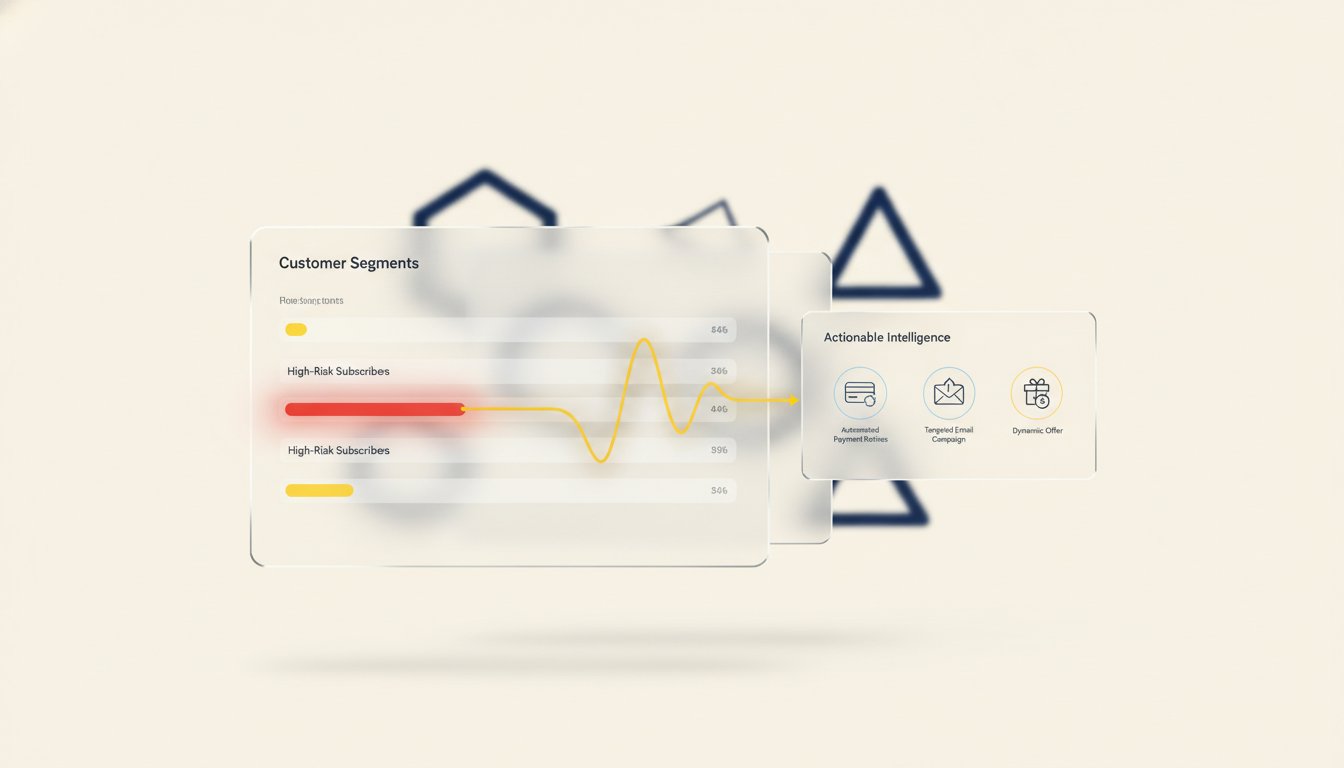
Subscription Churn Dashboard: The 2026 Guide to Actionable Revenue Intelligence
Up to 40% of subscription churn is involuntary, meaning your customers aren't choosing to leave; they're being forced out by...