ARTICLE
Mastering Net Revenue Retention: How to Calculate NRR for SaaS Growth in 2026

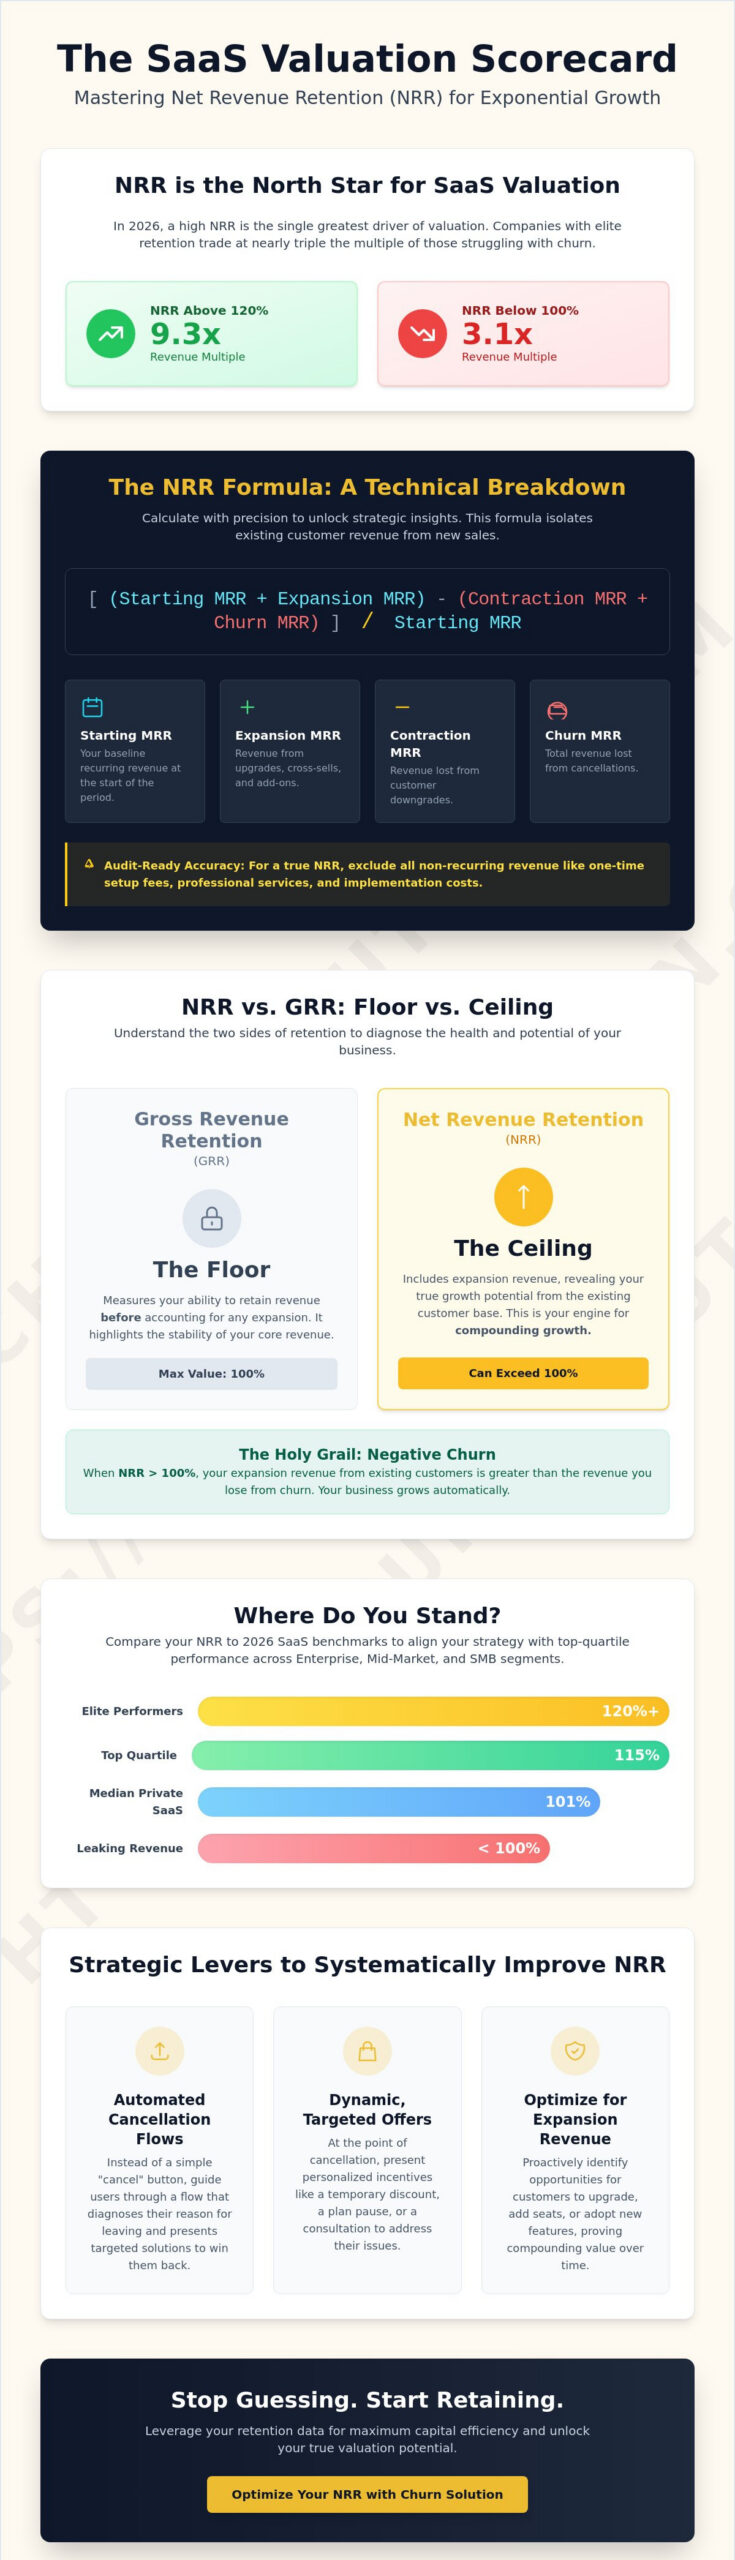
If your SaaS valuation isn’t where you want it, stop looking at your sales pipeline and start auditing your retention ecosystem. In 2026, public SaaS companies with a Net Revenue Retention (NRR) above 120% trade at a 9.3x revenue multiple, nearly triple the valuation of those struggling below the 100% mark. NRR is no longer just a reporting requirement; it’s the ultimate scorecard for your automated retention engine. You need to know exactly how to calculate nrr to identify where your growth is stalling and where it’s accelerating.
You likely already recognize that high churn can silently erode your bottom line, yet the real danger lies in failing to accurately track expansion revenue. This confusion often masks underlying growth opportunities or hides critical leaks in your subscription model. This article provides a clear, audit-ready NRR formula and explains the vital differences between Net and Gross Revenue Retention. We’ll explore the latest 2026 benchmarks for your specific customer segments and deliver actionable strategies to optimize your retention layers. It’s time to stop guessing and start leveraging your data for maximum capital efficiency.
Key Takeaways
- Master the precise formula for how to calculate nrr to accurately quantify expansion revenue and identify hidden contraction within your subscription base.
- Analyze the 2026 retention benchmarks across Enterprise, Mid-Market, and SMB segments to align your growth strategy with top-quartile performance.
- Differentiate between Gross and Net Revenue Retention to understand the “floor” and “ceiling” of your business health and valuation potential.
- Discover how to leverage automated cancellation flows and dynamic offers as strategic levers to systematically increase your retention metrics.
- Evaluate why NRR has become the critical scorecard for SaaS valuation, directly influencing revenue multiples in the current high-performance market.
What is Net Revenue Retention (NRR)? The Ultimate SaaS Growth Metric
Net Revenue Retention (NRR) is the definitive measure of how much recurring revenue your business retains from its existing customer base over a set period. Unlike simple customer churn, which only tracks the number of accounts lost, NRR accounts for every dollar gained through upsells and every dollar lost through downgrades or cancellations. It provides a transparent view of your company’s ability to grow without adding a single new customer. If you want to understand the true health of your SaaS business model, you must master the mechanics of this metric.
In the 2026 market, NRR has become the primary “North Star” for valuation. Data indicates that public companies with an NRR above 120% trade at a median revenue multiple of 9.3x. Compare this to the 3.1x multiple assigned to companies with NRR below 100%. The gap is staggering. Investors no longer reward growth at all costs; they reward efficient, sustainable expansion. Learning how to calculate nrr correctly allows you to demonstrate that your product delivers compounding value, leading to the holy grail of SaaS: negative churn. Negative churn occurs when expansion revenue from existing users exceeds the revenue lost from those who leave, essentially creating a self-sustaining growth engine.
Why Investors Prioritize NRR Over New Logos
Acquiring a new customer is significantly more expensive than retaining an existing one. High NRR signals a deep product-market fit because it proves that customers aren’t just staying; they’re increasing their investment. Many high-growth startups suffer from “leaky bucket” syndrome, where massive marketing spend on new logos masks a fundamental failure to keep current users. Investors prioritize NRR because it validates that your retention strategy is working. It shows that your revenue is stable, predictable, and capable of organic scaling.
The Components of Net Revenue Retention
To understand how to calculate nrr, you must first isolate its three core moving parts. Precision here is non-negotiable for audit-ready reporting.
- Starting MRR: This is the total Monthly Recurring Revenue at the very beginning of your measurement period. It serves as your baseline.
- Expansion MRR: This includes all additional revenue generated from your existing cohort through seat additions, plan upgrades, or cross-sells.
- Contraction and Churn: Contraction represents revenue lost when customers downgrade to lower tiers, while churn is the total revenue lost from customers who cancel entirely.
By balancing these three elements, you get a clear picture of your revenue depth. While the median NRR for private SaaS companies currently sits at 101%, top-quartile performers are hitting 115% or higher by aggressively optimizing these components.
The NRR Formula: A Technical Breakdown of the Calculation
Precision in your data is the difference between a strategic insight and a boardroom error. To master how to calculate nrr, you must apply a rigorous mathematical framework that isolates existing customer behavior from new sales activity. The primary NRR formula is: [(Starting MRR + Expansion MRR) – (Contraction MRR + Churn MRR)] / Starting MRR. This result is always expressed as a percentage. While you can calculate this on a monthly basis to spot immediate trends, an annual view provides the stability required for long-term financial planning.
Accuracy depends on what you exclude. Never include one-time implementation fees, setup costs, or professional services revenue in this calculation. These are non-recurring and will artificially inflate your retention figures, leading to a distorted view of your business health. Stick exclusively to recurring subscription revenue to ensure your metrics are audit-ready.
Step 1: Auditing Your Starting MRR
Your baseline must be bulletproof. Segment your customer cohorts by sign-up date or contract value to enable longitudinal tracking. This allows you to see how specific groups evolve over time. You must also distinguish between committed revenue (contracts signed) and recognized revenue (services delivered). Integrating your billing data with advanced churn metrics ensures that your starting point isn’t compromised by manual entry errors or outdated spreadsheets.
Step 2: Accounting for Expansion and Contraction
Expansion revenue includes seat additions, plan upgrades, and feature add-ons from your existing base. Contraction, conversely, represents revenue lost when a customer downgrades to a lower tier without fully canceling. Expansion revenue is the primary driver of NRR exceeding 100%. If your expansion isn’t outpacing your contraction and churn, your business is effectively shrinking from within. If your data shows a gap here, it’s time to audit your retention flows to capture lost expansion opportunities.
Step 3: Calculating Final Percentage
The final division yields your scorecard. A common pitfall is including “new logos” or sales from entirely new customers in the numerator; this is a fatal mistake that turns NRR into a general growth metric rather than a retention metric. For global SaaS models, currency fluctuations can also skew results. Use a constant currency calculation to ensure that exchange rate volatility doesn’t mask underlying performance issues.
Consider a hypothetical B2B SaaS company in 2026. They start the month with $100,000 in MRR. During that month, existing customers add $15,000 in expansion revenue. However, they lose $5,000 to downgrades (contraction) and $2,000 to full cancellations (churn). The calculation is: ($100,000 + $15,000 – $5,000 – $2,000) / $100,000. The result is 108%. This indicates a healthy, expanding base that is growing organically by 8% monthly before a single new sale is made.
NRR vs. GRR: Understanding the Revenue Retention Hierarchy
While mastering how to calculate nrr provides a comprehensive view of your revenue velocity, it can occasionally obscure fundamental product flaws. Gross Revenue Retention (GRR) serves as the absolute floor of your performance. It measures your ability to retain the original revenue from your customer base without the “buffer” of upsells or cross-sells. Essentially, GRR removes expansion revenue from the equation to show exactly how much of your core business remains. You must track both to ensure your growth is structurally sound.
A high Net Revenue Retention (NRR) can sometimes mask a dangerously low GRR. If your NRR is 115% but your GRR is only 80%, you are running a high-churn business that relies on a small segment of power users to subsidize a mass exodus of other accounts. This creates a fragile ecosystem. For a technical comparison of these mechanics, see our definitive guide on Gross vs. Net Churn. Top performers in 2026 aim for a GRR above 90%, ensuring that the core product value is undeniable before layering on expansion revenue. To go deeper on how these two metrics interact and which one your team should prioritize at your current stage, our comprehensive breakdown of GRR vs. NRR as SaaS revenue retention metrics provides the precise formulas and frameworks you need.
When to Focus on GRR
GRR is the primary metric for measuring the health of your core product value. Customer success teams typically “own” GRR because their primary objective is to prevent revenue leakage through churn and contraction. Sales and account management often own the expansion component that drives NRR. If you identify “unhealthy” expansion, where customers buy more features but continue to churn at high rates in other segments, your business lacks a solid foundation. In these cases, focus on stabilizing your GRR before aggressively pursuing upsells.
The Relationship Between NRR and NDR
In the current SaaS landscape, Net Dollar Retention (NDR) is frequently used interchangeably with NRR. While they represent the same underlying data, nuances in terminology exist across different venture capital and private equity firms. Some institutional investors prefer NDR when discussing account-level growth, while others use NRR as the standard for enterprise-wide health. You should standardize your internal vocabulary for board reporting to avoid confusion. Whether you call it NDR or NRR, the goal remains the same: proving that your existing customer base is worth more today than it was yesterday. Standardizing this data ensures your reporting is consistent, professional, and ready for high-stakes valuation discussions.
Industry Benchmarks and the Psychology of Churn Analysis
Benchmarks are not just goals; they are survival metrics. In 2026, the median Net Revenue Retention (NRR) for private SaaS companies sits at approximately 101%, but this blended average masks significant performance gaps between customer segments. If you serve the enterprise market (>$100k ACV), the median NRR climbs to 118%. Conversely, SMB-focused SaaS companies (<$25k ACV) typically see a median NRR of 97%. This 21 point gap exists because SMBs face higher business failure rates and lower switching costs, making them naturally more volatile. Understanding how to calculate nrr within these specific segments is the only way to set realistic, high-performance targets for your team.
While the quantitative formula provides the “what,” qualitative data reveals the “why.” A sudden dip in your retention percentage is a symptom of a deeper problem in the customer journey. You cannot fix a metric you don’t understand. Integrating sophisticated feedback analysis into your reporting allows you to bridge the gap between revenue data and customer sentiment. This dual approach ensures you aren’t just reacting to losses but proactively hardening your revenue base.
Analyzing the “Why” Behind Churn
Numbers tell you a customer left; narratives tell you how to prevent the next departure. You must move beyond the spreadsheet to capture the specific friction points causing revenue leakage. Deploying automated exit surveys at the moment of cancellation allows you to categorize revenue loss into actionable segments. In the current market, the top three drivers of contraction are budget consolidation, low feature adoption, and aggressive competitor moves. By tagging each lost dollar with a specific reason, you turn churn into a roadmap for product and success optimization.
The Impact of Involuntary Churn on NRR
Involuntary churn is a silent killer of your valuation. It occurs when a customer has every intention of staying, but their payment fails due to expired cards, network errors, or outdated billing info. This isn’t a product problem; it’s a technical leak. The math of recovery is powerful. A 5% increase in payment success rates doesn’t just save a single month of revenue; it compounds your NRR over the entire customer lifetime. Leveraging smart retries and automated dunning ensures your baseline revenue remains protected from avoidable failures. Stop letting technical debt erode your growth and start recovering your lost revenue today.
Top-quartile performers in 2026 don’t just know how to calculate nrr; they know how to manipulate the psychological and technical levers that drive it. Whether you are battling SMB volatility or protecting enterprise accounts, your retention strategy must be as automated and data-driven as your sales pipeline.
Strategic Levers: How to Systematically Improve Your NRR
Knowing how to calculate nrr is only the first step; the real value lies in your ability to influence the result through operational excellence. In the high-stakes subscription economy, you cannot afford to treat retention as a passive outcome. You must transition from retrospective measurement to proactive, automated intervention. By deploying sophisticated Cancellation Flows, you can intercept churn at the exact moment of intent, converting potential exits into revenue-preserving pauses or strategic downgrades that keep the customer within your ecosystem. This shift turns a binary stay or go decision into a nuanced negotiation managed by data.
Real-time recovery requires precision. Implementing dynamic offers based on specific customer segments or feedback categories allows you to present the right incentive at the right time. For instance, a user citing temporary budget constraints should receive a discount or a plan pause, while one citing missing features might benefit from a targeted upsell to a higher tier. For a comprehensive look at these mechanisms, consult our resource on The Definitive Guide to Automated Cancellation Flows. This approach ensures that every dollar at risk is met with a calculated counter-measure.
Maximizing Expansion with Targeted Interventions
Expansion revenue is the engine that drives NRR beyond the 100% threshold. To optimize this, you must identify power users within your data who are consistently hitting usage limits. Instead of relying on manual sales outreach, automate the expansion path within your customer portal. Automated triggers can prompt seamless plan upgrades the moment a user approaches their current capacity or feature limits. This frictionless experience captures expansion revenue at the peak of customer need, directly boosting your net retention without increasing your sales overhead. Mastering how to calculate nrr ensures you have the data, but these strategic levers ensure that data shows consistent growth. For a complete tactical framework covering every layer of your retention stack, the SaaS retention strategies resource guide for 2026 provides the automated systems and precision frameworks required to slash churn and maximize NRR.
Recovering Lapsed Revenue
NRR isn’t just about who stays; it’s about who returns. High-performance reactivation campaigns target former high-value accounts with win-back strategies tailored to their original reason for departure. By using AI-driven feedback analysis from their previous exit, you can address their specific pain points in your re-engagement messaging. This closes the loop on your retention strategy. It ensures that even when a customer churns, the data gathered during their exit serves as a blueprint for their eventual recovery and the prevention of future contraction across your entire base.
Operationalizing Your Retention Strategy for 2026 Valuations
Mastering how to calculate nrr is the first step toward securing the premium valuations seen by top-quartile SaaS performers. You’ve identified the technical components of the formula and the critical distinction between net and gross retention. Now, you must move from measurement to manipulation. A high-performance NRR is the direct result of systematic interventions that minimize contraction while accelerating expansion revenue. By isolating core product health and layering on targeted expansion triggers, you transform your existing customer base into your most efficient growth engine.
Churn Solution offers the specialist tools required to plug revenue leaks and optimize every customer touchpoint. Our automated revenue recovery engine and AI-driven feedback analysis are used by high-growth SaaS companies globally to harden their revenue base and recover lost revenue in real-time. Don’t let underlying churn mask your growth potential or erode your market position. Take control of your revenue destiny and protect and grow your NRR with Churn Solution’s automated retention tools. Your path to capital efficiency starts with better data and smarter automation.
Frequently Asked Questions
How is NRR different from Net Dollar Retention (NDR)?
NRR and NDR are functionally identical in most B2B SaaS contexts. Both metrics track the percentage of recurring revenue retained from a specific cohort of customers over a set period. While the terminology varies depending on whether you are reporting to venture capital firms or internal stakeholders, the underlying math remains the same. You should standardize one term within your organization to maintain reporting consistency across all departments.
Should I include new customer revenue in my NRR calculation?
No, you must strictly exclude revenue from new customers acquired during the measurement period. NRR is designed to measure the health and expansion of your existing cohort. When you learn how to calculate nrr, you’ll see that including “new logos” in the numerator creates a false growth signal. This makes it impossible to distinguish between a healthy retention engine and a high-churn business with aggressive sales.
What is a good NRR for a B2B SaaS company in 2026?
A “good” NRR depends heavily on your target market and Average Contract Value (ACV). For enterprise-level SaaS, the gold standard is 120% or higher. Mid-market companies should aim for 100% to 110% to ensure they are at least replacing churned revenue with expansion. If your NRR falls below 90%, your business is structurally shrinking, which will negatively impact your valuation and long-term sustainability.
How does involuntary churn affect my Net Revenue Retention?
Involuntary churn acts as a silent tax on your retention metrics. It occurs when a customer’s subscription lapses due to technical failures like expired credit cards or network errors rather than a conscious decision to cancel. Because these customers intended to stay, this lost revenue represents an avoidable leak. Recovering these funds through automated dunning and smart retries is the most efficient way to protect your NRR baseline.
Can NRR be higher than 100%?
Yes, and achieving an NRR above 100% is the primary goal for scalable SaaS models. This phenomenon, known as “negative churn,” happens when expansion revenue from upsells and seat additions exceeds the revenue lost to cancellations and downgrades. An NRR above 100% proves that your product delivers compounding value, allowing your company to grow organically without relying solely on new customer acquisition.
How often should I calculate and report on NRR?
Track your NRR on a monthly basis to identify immediate trends and the success of your retention interventions. For board meetings and long-term strategic planning, report on a quarterly or trailing twelve-month (TTM) basis. Monthly tracking helps you spot sudden spikes in contraction, while longer measurement periods provide the stability needed to accurately assess your overall business health and capital efficiency.
Who should “own” the NRR metric in a SaaS organization?
NRR is a cross-functional metric that requires alignment between Customer Success and Sales. Customer Success typically owns the gross retention component by ensuring users achieve their desired outcomes and don’t churn. Sales or Account Management owns the expansion component by driving upsells and cross-sells. When both teams are incentivized by NRR, they work together to maximize the lifetime value of every account.
What is the difference between NRR and Gross Revenue Retention?
Gross Revenue Retention (GRR) is a more conservative metric that excludes expansion revenue entirely. It measures your ability to keep the original revenue you started with, capped at 100%. While how to calculate nrr involves adding expansion revenue to the numerator, GRR only accounts for losses. GRR reveals the “floor” of your product value, while NRR shows the “ceiling” of your revenue growth potential.
- Key Takeaways
- Table of Contents
- What is Net Revenue Retention (NRR)? The Ultimate SaaS Growth Metric
- The NRR Formula: A Technical Breakdown of the Calculation
- NRR vs. GRR: Understanding the Revenue Retention Hierarchy
- Industry Benchmarks and the Psychology of Churn Analysis
- Strategic Levers: How to Systematically Improve Your NRR
- Operationalizing Your Retention Strategy for 2026 Valuations
- Frequently Asked Questions

Churn solution that turns your customers right around.
Related Articles
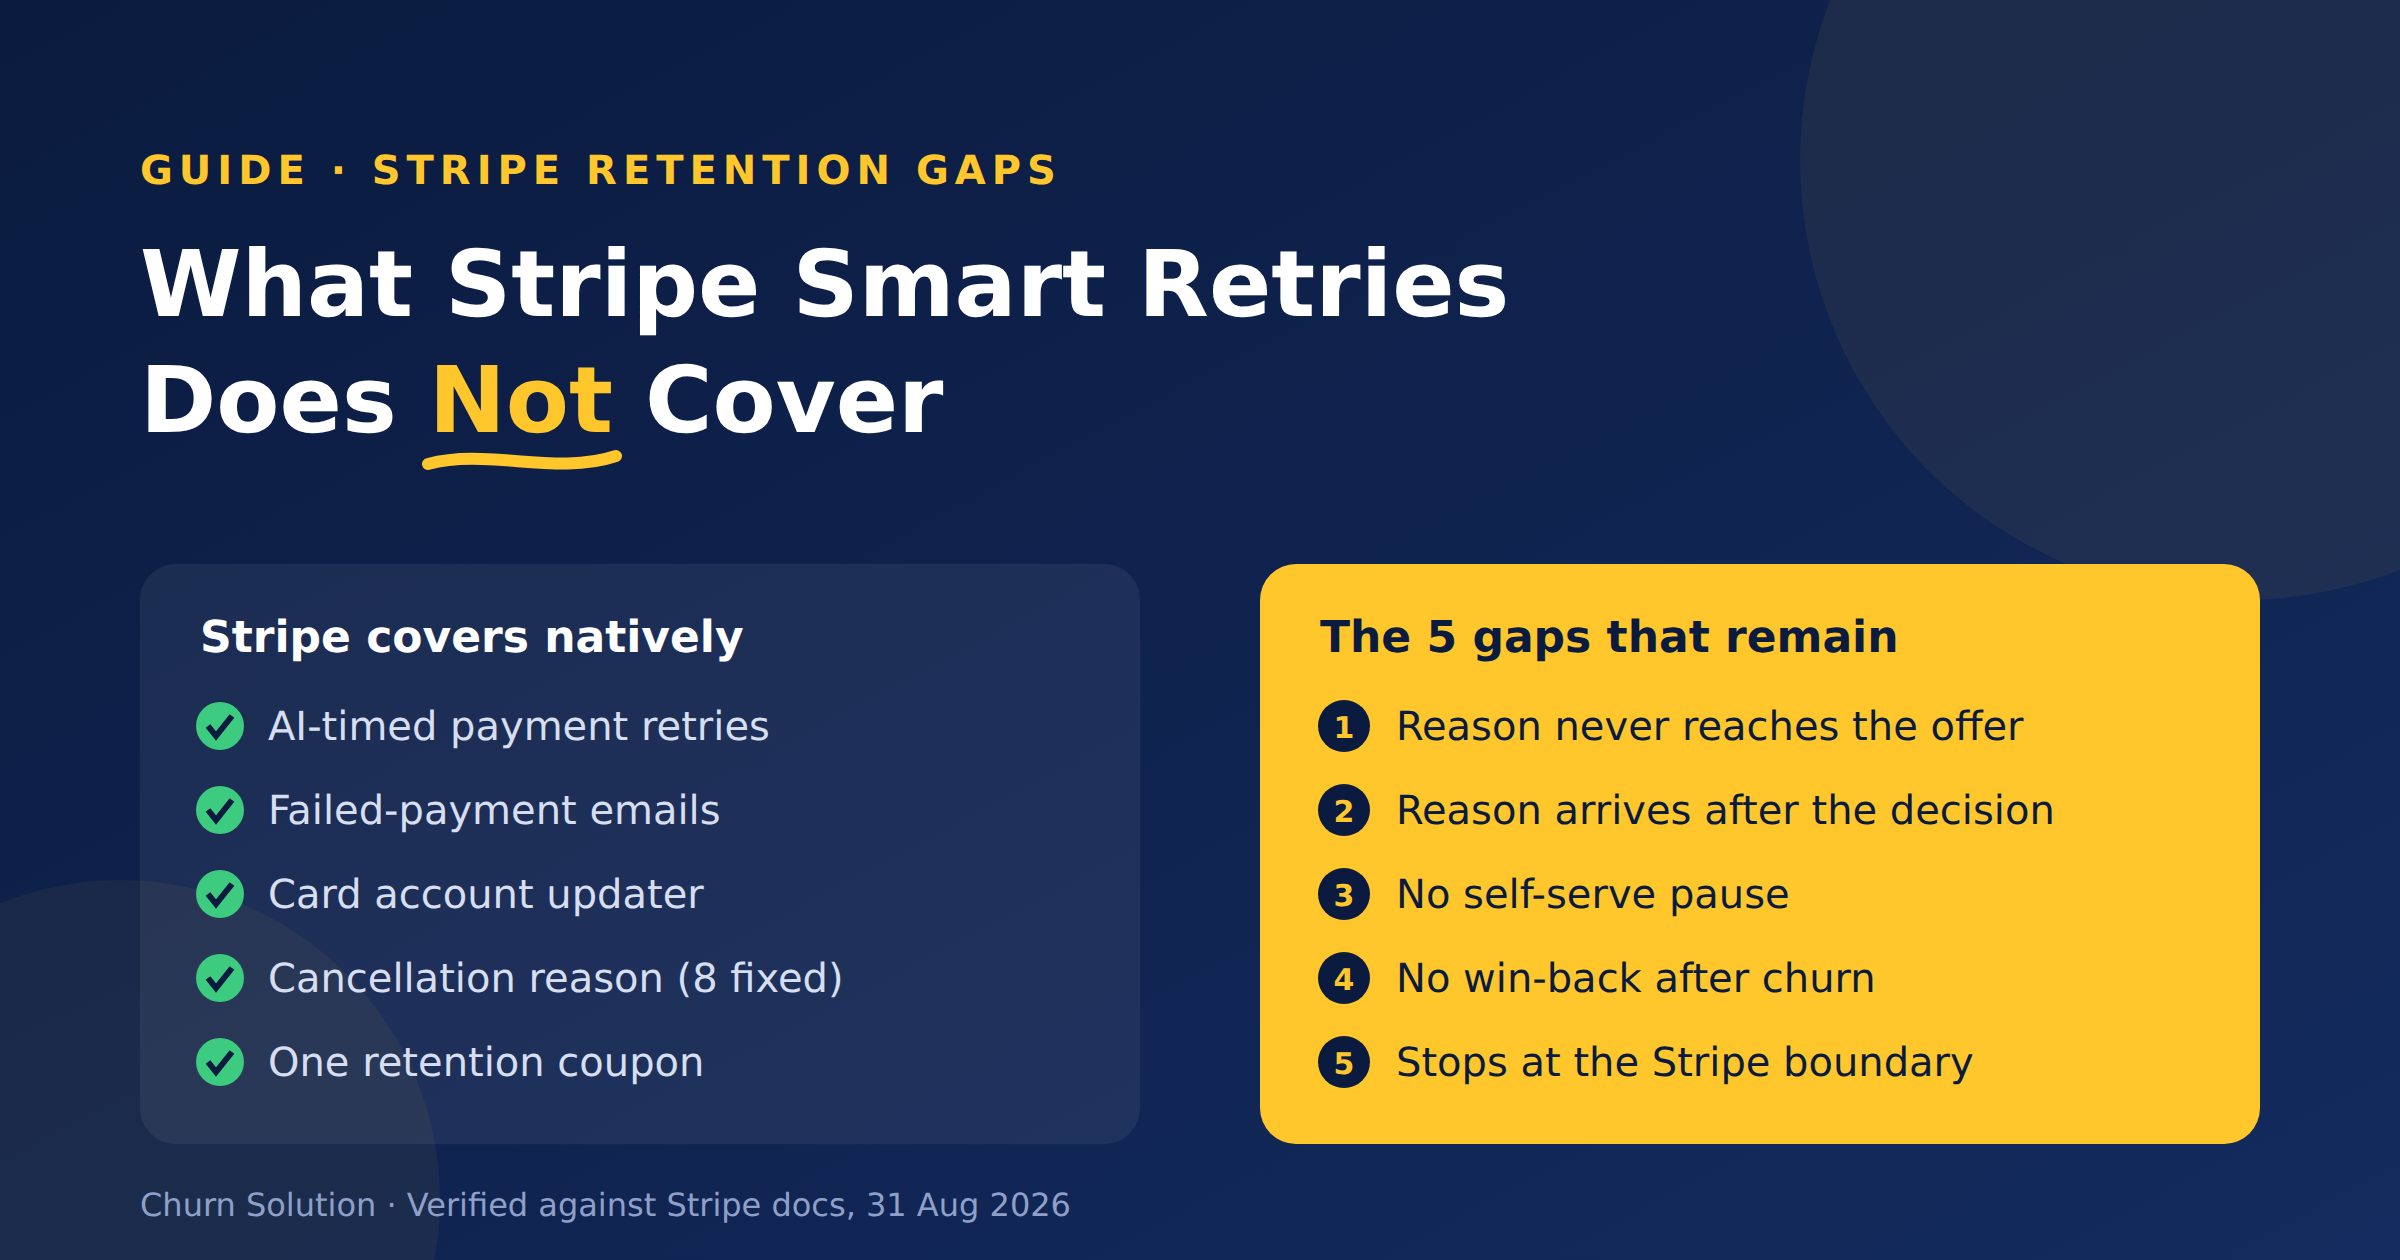
What Stripe Smart Retries Does Not Cover
Stripe Smart Retries recovers failed payments but doesn't run retention. Here are the five gaps that remain, sourced from Stripe's...


Membership Community Churn: The Members Who Quit Without Clicking Cancel
Quiet churn is the real leak: members who never clicked “cancel” at all. A card expires. A bank declines a...


Subscription Churn Dashboard: The 2026 Guide to Actionable Revenue Intelligence
Up to 40% of subscription churn is involuntary, meaning your customers aren't choosing to leave; they're being forced out by...