ARTICLE
GRR vs. NRR: The Definitive Guide to SaaS Revenue Retention Metrics

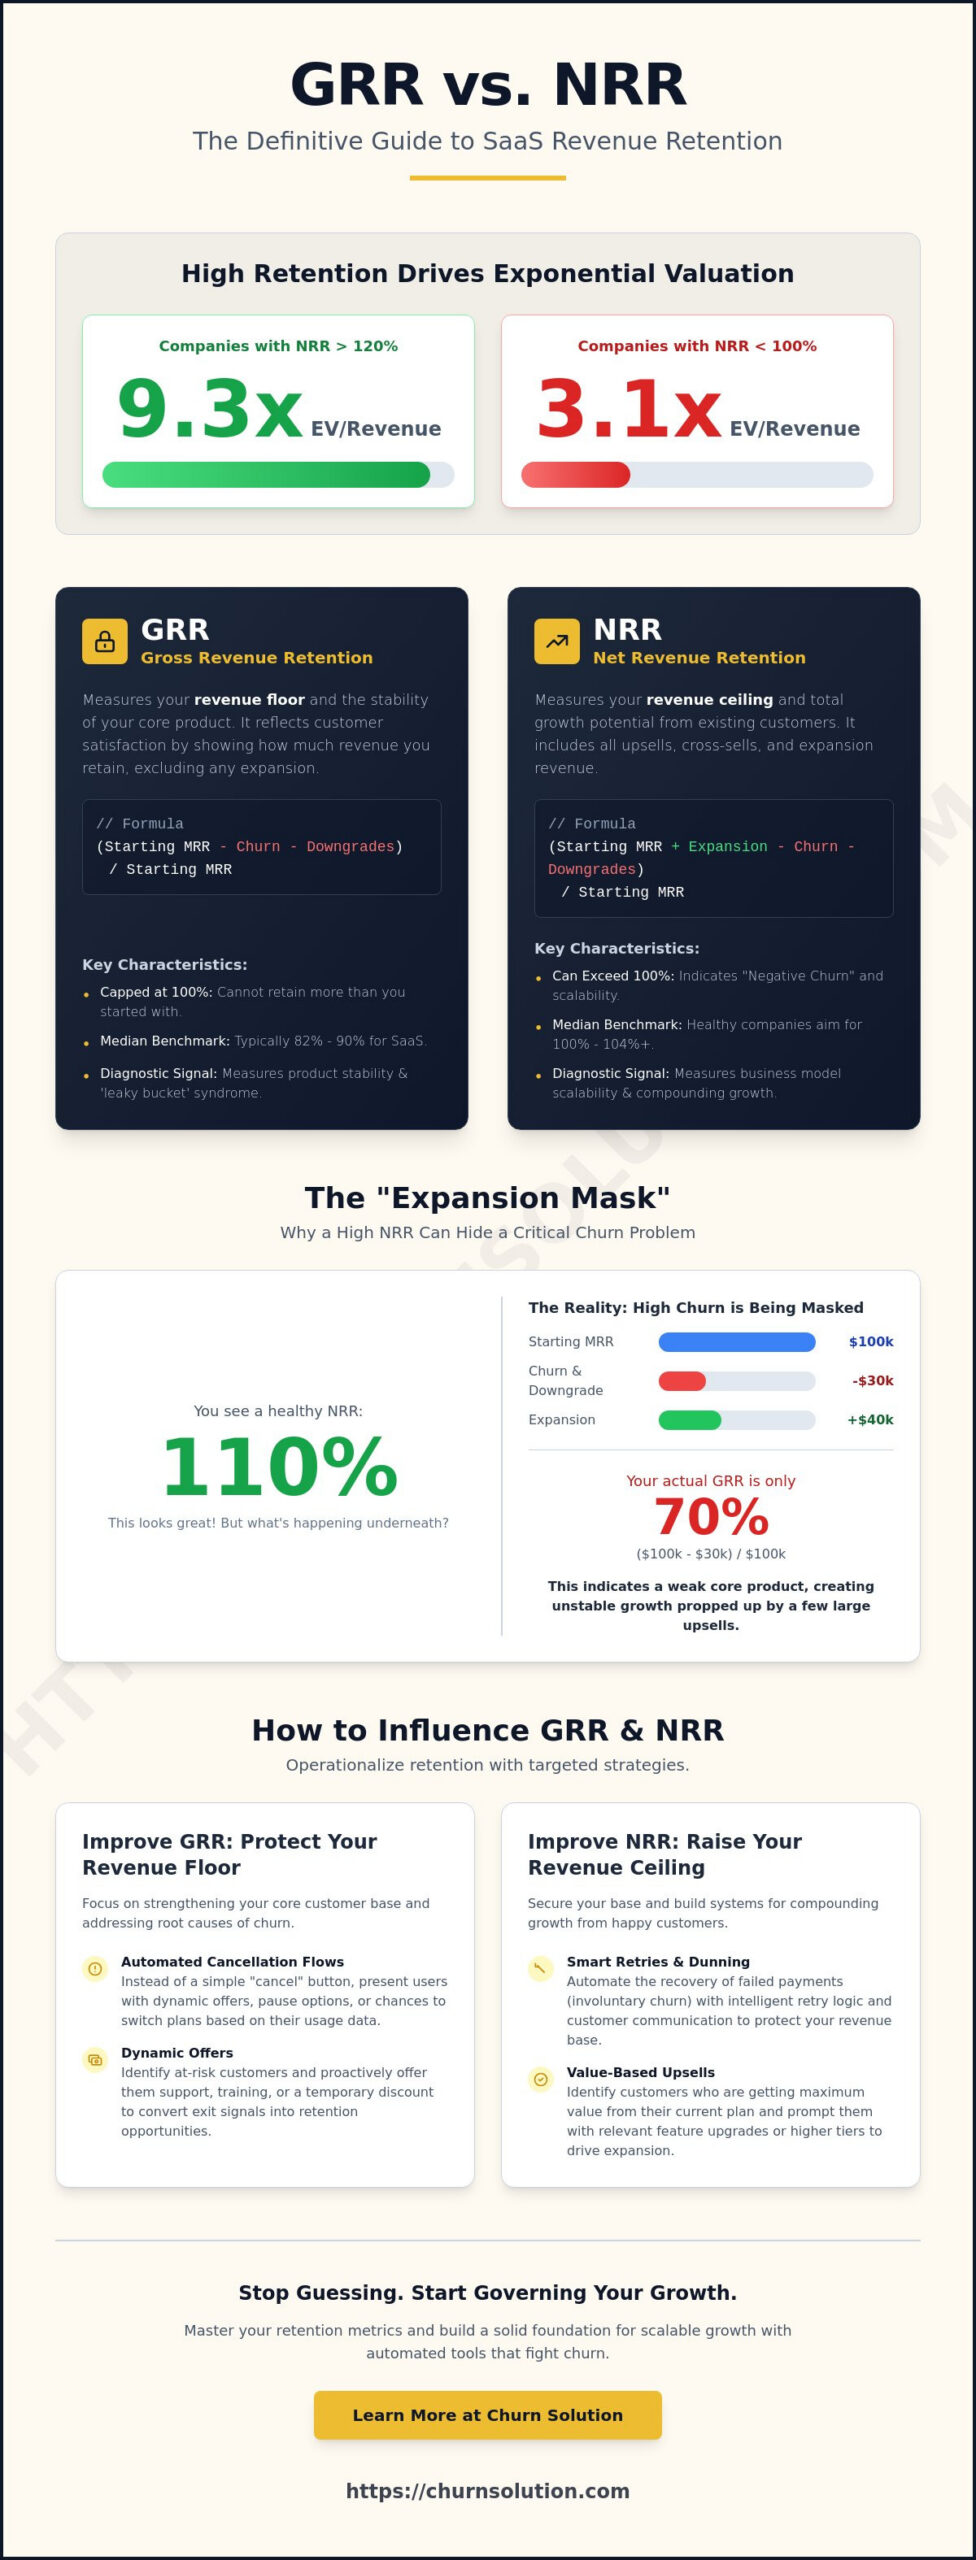
Public SaaS companies with Net Revenue Retention above 120% trade at a median of 9.3x EV/revenue, while those below 100% languish at 3.1x. You likely already know that retention is the lifeblood of your valuation; yet, many leadership teams still struggle to explain why their metrics fluctuate. It’s frustrating when high expansion revenue masks underlying churn, creating a false sense of security that eventually collapses during board reviews. Mastering the nuances of grr vs nrr is the only way to stop guessing and start governing your growth.
This guide empowers you to stop the revenue leaks that threaten your scalability. You’ll master the critical differences between Gross and Net Revenue Retention to identify exactly where your product-market fit is failing. We provide the precise formulas and frameworks you need to decide which metric to prioritize based on your company stage and customer segment. Finally, we’ll outline actionable ways to optimize both metrics through automated cancellation flows and smart retries, ensuring your revenue base remains a solid foundation for expansion.
Key Takeaways
- Distinguish between your revenue floor and ceiling by identifying how GRR measures core retention while NRR tracks total expansion potential.
- Leverage the grr vs nrr delta to expose the “Expansion Mask,” ensuring that aggressive upsells do not camouflage a deteriorating core customer base.
- Evaluate business health through the lens of product stability versus business model scalability to ensure long-term investment readiness.
- Implement automated cancellation flows and dynamic offers to convert exit signals into immediate retention opportunities.
- Utilize technical recovery mechanisms such as Smart Retries and dunning automation to neutralize involuntary churn and secure your revenue ceiling.
Defining GRR and NRR: The Foundations of SaaS Revenue Retention
Revenue retention is the primary driver of enterprise value in the subscription economy. To manage it effectively, you must distinguish between your revenue floor and your revenue ceiling. This requires a deep understanding of SaaS revenue retention metrics to ensure your data reflects reality rather than optimistic projections. The debate of grr vs nrr isn’t about which metric is better; it’s about which signal your business needs to prioritize to ensure long-term survival.
These two metrics provide distinct lenses through which to view your business health:
- Gross Revenue Retention (GRR): This represents the percentage of recurring revenue retained from your existing customer base, strictly excluding expansion revenue. It is your non-negotiable view of customer satisfaction.
- Net Revenue Retention (NRR): This measures the total change in recurring revenue from existing customers, including upsells and cross-sells. It illustrates the compound growth potential inherent in your current accounts.
If you only track NRR, you risk ignoring the structural integrity of your product. If you only track GRR, you miss the opportunity to quantify how much your customers are willing to grow with you. Balancing grr vs nrr allows you to see both the stability of your core offering and the scalability of your business model.
The GRR Formula: Measuring the Revenue Floor
To calculate your revenue floor, use this formula: (Starting MRR – Churn – Downgrades) / Starting MRR. This calculation deliberately ignores any revenue gains from upsells or cross-sells. Because you cannot retain more than 100% of the revenue you started with, GRR has a hard cap at 100%.
This cap is vital for assessing business stability. A high GRR confirms that your customers find consistent, ongoing value in your core offering. In 2026, the median GRR for SaaS companies sits between 82% and 90%, according to EverHelp data. If your numbers fall below these benchmarks, it indicates that your primary product is losing its competitive edge or failing to meet its initial promises. GRR is the ultimate metric for measuring ‘leaky bucket’ syndrome because it exposes the raw rate of revenue loss before any expansion revenue can hide the damage.
The NRR Formula: Quantifying Expansion and Growth
NRR provides the ceiling for your revenue potential. The formula is: (Starting MRR + Expansion – Churn – Downgrades) / Starting MRR. Unlike its gross counterpart, NRR includes every dollar of expansion revenue, which allows the percentage to exceed 100%.
When NRR climbs above 100%, your business has achieved the “Negative Churn” phenomenon. This means the growth from your existing customers is fast enough to offset any revenue lost to cancellations or downgrades. It’s the gold standard for scalability and a primary input for high valuations. For 2026, median NRR benchmarks range from 100% to 104%. To optimize these figures, you must understand the specific variables that drive movement in your customer base. You can find a detailed breakdown in our guide on Mastering NRR Calculation for SaaS Growth.
GRR vs. NRR: Deciphering the Signals in Your Revenue Data
GRR and NRR provide distinct diagnostic signals. GRR acts as your defensive shield; it measures how well you protect your existing revenue. NRR is your offensive weapon, quantifying how effectively you extract more value from current accounts. When analyzing grr vs nrr, the relationship between the two reveals the structural integrity of your growth. You cannot simply look at one in isolation if you want a clear picture of your business health.
A GRR above 90% is the gold standard for enterprise B2B SaaS. It indicates that your core value proposition is sticky and that you’ve achieved true product-market fit. Conversely, an NRR above 110% signals a high-performance business model capable of compounding revenue without relying solely on new customer acquisition. High-growth leaders use grr vs nrr analysis to determine if they are playing enough offense. If your GRR is perfect but NRR is flat, you are sitting on untapped expansion potential. If the inverse is true, your growth is unstable and likely propped up by a few heavy-spending accounts.
When GRR is the Priority
Early-stage companies must obsess over GRR. During this phase, your goal is to validate that your product solves a persistent problem for a specific segment. Low GRR is an early warning of “leaky bucket” syndrome. It forces you to distinguish between logo churn and revenue churn. If you are losing small logos but retaining high-value revenue, your GRR might remain stable, but you still need to investigate why the lower segment is failing to find value. Identifying these signals early allows you to pivot before the burn rate becomes unsustainable. You can analyze these patterns more deeply by using automated churn tracking to isolate exactly where the leaks occur in your funnel.
When NRR Takes Center Stage
As you scale toward Series B funding or an IPO, NRR becomes the primary metric for valuation. This investor perspective on Net Dollar Retention highlights why VCs view NRR as a crystal ball for future success. High NRR proves that your account management team and expansion playbooks are efficient. It demonstrates that you can grow your footprint within an organization through cross-sells and upsells. However, never let high expansion figures blind you to underlying retention issues. For a complete breakdown of how these metrics interact, read our Gross vs. Net Churn: The Definitive Guide. If you are ready to start protecting your revenue floor today, create your account and deploy your first recovery flow.
The Expansion Mask: Why High NRR Can Hide a Critical Churn Problem
Net Revenue Retention is a powerful growth indicator, but it frequently functions as a mask. In the current SaaS economy, a high NRR can camoflauge a deteriorating core business. If your NRR is 115% while your GRR is 70%, you aren’t building a sustainable company; you are cannibalizing a shrinking customer base. Investors in 2026 have moved past surface-level growth metrics. They now scrutinize the delta in grr vs nrr to determine if your expansion revenue is sustainable or merely a temporary hedge against high churn.
This “Expansion Mask” occurs when a few high-performing accounts grow fast enough to offset a mass exodus of smaller customers. While your total revenue increases, your market share and product-market fit are actually declining. You must cross-reference your revenue metrics with logo retention to identify “fake” growth before it reaches a breaking point. Relying on expansion to fix a churn problem is a high-risk strategy that eventually leads to a sudden revenue cliff when your remaining “whale” accounts reach their maximum seat count or budget capacity.
The “Whale” Account Risk
A single enterprise account expansion can easily hide 20% churn within your mid-market segment. This concentration of revenue creates a fragile ecosystem where the loss of one or two key customers could devastate your valuation. To expose these hidden leaks, you must move beyond blended averages. Segment your data to see how retention performs across different tiers. High-performance teams leverage customer segmentation to protect revenue, allowing them to isolate where the product is failing and where it is succeeding. If your GRR is consistently lower in specific segments, it signals a localized failure in your value proposition that NRR simply cannot fix.
Product-Market Fit vs. Sales Momentum
GRR serves as the only true measure of whether your product solves a persistent, non-negotiable problem for your users. High NRR often reflects the efficiency of your sales and account management teams rather than the inherent value of the software. NRR measures the strength of your sales engine, while GRR measures the health of your product’s heart. When these two metrics diverge significantly, you are likely experiencing sales momentum without long-term product-market fit. This imbalance is unsustainable. Eventually, the “leaky bucket” will empty faster than your sales team can refill it, leading to a stagnation that no amount of upselling can reverse. Stop the bleeding by focusing on the fundamentals of revenue protection.
Operationalizing Retention: How to Influence GRR and NRR in Real-Time
Most SaaS leadership teams treat retention as a monthly post-mortem. This passive approach is a strategic failure. To truly master the relationship between grr vs nrr, you must transition from reporting metrics to recovering revenue in real-time. Data without immediate action is merely a historical record of loss. By integrating automated triggers into your billing stack, you can neutralize churn signals before they hit your ledger, effectively turning potential exits into expansion opportunities.
The goal is to create a responsive ecosystem where every customer interaction influences your retention floor and growth ceiling. When you move from passive observation to active intervention, you gain control over the fluctuations that often baffle board members. This requires a two-pronged strategy: defensive maneuvers to protect your core revenue and offensive tactics to drive expansion. Each signal in your data should trigger a specific, automated playbook designed to stabilize your business model. For a comprehensive overview of the tactical frameworks and automated systems that power this approach, explore these SaaS retention strategies for revenue growth in 2026.
Defending GRR with Cancellation Flows
GRR is your revenue floor. To protect it, you must deploy automated cancellation flows that act as a final line of defense. When a user clicks “cancel,” they provide a critical window for intervention. Use exit surveys to capture qualitative data on why the product is failing to meet expectations. This actionable feedback analysis reveals structural leaks that you can fix at the product level. By offering immediate alternatives based on user sentiment, you neutralize the “leaky bucket” syndrome and preserve your revenue floor.
Boosting NRR with Smart Interventions
NRR requires an offensive strategy focused on growth and longevity. You can influence this by automating dynamic offers that steer users away from full cancellations toward downgrades or account pauses. A “pause” keeps the account alive, preserving the opportunity for future expansion MRR. Additionally, reactivation campaigns target churned users with tailored incentives, effectively turning lost revenue back into expansion growth. NRR measures the sales engine, while GRR measures the product heart. A/B testing these interventions ensures your win-back campaigns are optimized for the highest possible impact on your grr vs nrr delta.
Involuntary churn is the silent killer of both metrics. Failed credit cards account for a significant portion of revenue loss that has nothing to do with product satisfaction. Implementing payment recovery and dunning automation protects your GRR by preventing accidental churn and secures your NRR by keeping high-value expansion accounts active. This technical layer of revenue protection ensures that your hard-won growth isn’t eroded by preventable administrative failures.
Ready to stop the leaks and scale with precision? Launch your first recovery campaign today.
Scaling Revenue Protection: Automating the Path to 100%+ NRR
Consolidating your retention stack is the final step in moving from reactive reporting to proactive revenue governance. You cannot scale a subscription business by manually managing every churn event or expansion opportunity. True efficiency requires a unified system that protects your revenue floor while simultaneously clearing the path for expansion. High-growth SaaS leaders view grr vs nrr as a single, integrated challenge rather than two separate problems. By automating the protection of both metrics, you ensure that your growth is built on a foundation of structural stability.
Establishing a “Revenue Protection” culture means valuing GRR as much as NRR. While expansion revenue is glamorous, it is also volatile. A high-performance business model treats every dollar of core revenue as a non-negotiable asset. This shift in mindset requires sophisticated technology to monitor health signals and execute recovery playbooks without human intervention. When your organization prioritizes the integrity of its revenue base, you create the predictability that investors demand and the scalability that your market position requires.
Automated Payment Recovery as a Metric Lever
Involuntary churn is a purely technical failure that erodes your business from the inside out. Implementing payment recovery automation directly preserves your GRR by intercepting failed transactions before they result in a cancellation. These administrative losses are often the easiest leaks to plug; yet, they represent a significant portion of total churn for many SaaS providers. Recovering these funds has a powerful compound effect on your NRR over a 12-month period.
A 1% improvement in monthly payment recovery rates compounds into a 12.6% increase in annual NRR growth because those retained customers remain eligible for future expansion and upsells. This mechanism transforms a simple billing fix into a strategic growth lever. By neutralizing payment friction, you keep your highest-value accounts active and ready for expansion motions. This technical layer of protection is essential for maintaining the balance in the grr vs nrr equation.
Future-Proofing Retention in 2026
The next phase of revenue protection involves utilizing AI-driven predictive triggers to intervene before a GRR event even occurs. By integrating AI feedback analysis, you can identify patterns of dissatisfaction and deploy save attempts proactively. Modern buyers also expect autonomy; providing a Customer Portal allows for “Self-Service Retention” where users can manage their own downgrades or pauses. This reduces friction and preserves the relationship even when the current contract size changes. Finally, eliminating the manual retry process with Smart Retries ensures that your billing engine operates at peak efficiency, protecting every dollar of recurring revenue.
Your revenue base is your most valuable asset. Stop leaving its protection to chance. Protect your revenue base and scale NRR with Churn Solution.
Take Command of Your Revenue Architecture
Mastering the balance of grr vs nrr is no longer optional for SaaS leaders who demand sustainable growth. You now understand that while Net Revenue Retention signals your expansion potential; Gross Revenue Retention remains the ultimate validator of your product core value. Relying on expansion to mask underlying churn is a high-risk strategy that investors in 2026 will quickly expose. Don’t wait for a board-level crisis to implement technical safeguards that protect your revenue floor.
Deploying a sophisticated retention stack allows you to neutralize threats in real-time. Leading SaaS brands leverage automated payment recovery to stop administrative churn and AI-driven feedback analysis to identify structural product leaks. By integrating dynamic cancellation flows, you transform potential exits into opportunities for downgrades or pauses. It’s time to ensure your valuation remains robust and your growth remains predictable.
Stop the leaks in your GRR and NRR with Churn Solution. You have the strategic framework; now deploy the tools to secure your future.
Frequently Asked Questions
Is GRR or NRR more important for a SaaS company?
Both metrics are essential, but their priority shifts based on your company stage. Early-stage startups must prioritize Gross Revenue Retention to validate product-market fit and ensure their core value proposition is sticky. Growth-stage companies focus on Net Revenue Retention because it is the primary driver of valuation and scalability. You cannot build a sustainable expansion engine on a foundation of high underlying churn; therefore, stabilize your GRR floor before optimizing your NRR ceiling.
Can Net Revenue Retention (NRR) be over 100%?
Yes, and achieving an NRR over 100% is the gold standard for healthy SaaS businesses. This phenomenon, known as negative churn, occurs when expansion revenue from upsells and cross-sells exceeds the revenue lost from cancellations and downgrades. In 2026, median NRR benchmarks for B2B SaaS range from 100% to 104%, while top-tier companies often exceed 120% to drive exponential growth from their existing customer base.
How does involuntary churn affect GRR vs. NRR?
Involuntary churn, often caused by failed credit card transactions, erodes both metrics simultaneously. It lowers your GRR by removing baseline revenue and restricts your NRR by eliminating accounts that could have otherwise expanded. This administrative loss has nothing to do with product satisfaction. Implementing technical solutions like Smart Retries and dunning email automation is the most efficient way to neutralize these leaks and protect your revenue integrity.
What is a good benchmark for Gross Revenue Retention in B2B SaaS?
A GRR between 82% and 90% is the median benchmark for SaaS companies in 2026. For enterprise-level B2B SaaS, a “good” rate is typically 90% or higher. If your GRR falls below 80%, it indicates a structural problem with your product or a misalignment in your target customer segment. Monitoring the delta in grr vs nrr helps you identify if high expansion is dangerously camouflaging these core retention issues.
How do I calculate NRR if I have significant downgrades?
You must treat downgrades as a direct reduction in your revenue base. The formula is (Starting MRR + Expansion – Churn – Downgrades) / Starting MRR. Significant downgrades often signal that customers are finding less value in your higher-tier features or are consolidating their tech stacks. High-performance teams use dynamic offers during the cancellation flow to steer users toward a downgrade rather than a full cancellation, preserving the account for future recovery.
What is the difference between revenue retention and logo retention?
Revenue retention measures the dollars kept, while logo retention measures the number of unique customers retained. It is possible to have high revenue retention while experiencing high logo churn if your largest “whale” accounts stay while smaller customers leave. Comparing these metrics reveals if your growth is diversified across your entire base or dangerously concentrated in a few high-stakes contracts that could devastate your valuation if they churn.
How can automated cancellation flows improve my GRR?
Automated cancellation flows intercept users at the exact moment they intend to leave. By using exit surveys to identify the root cause of dissatisfaction, you can present tailored save attempts or dynamic offers that address the user’s specific pain point. This proactive intervention converts potential churn events into retention successes, directly stabilizing your GRR and providing the qualitative data needed to fix long-term product leaks.
- Key Takeaways
- Table of Contents
- Defining GRR and NRR: The Foundations of SaaS Revenue Retention
- GRR vs. NRR: Deciphering the Signals in Your Revenue Data
- The Expansion Mask: Why High NRR Can Hide a Critical Churn Problem
- Operationalizing Retention: How to Influence GRR and NRR in Real-Time
- Scaling Revenue Protection: Automating the Path to 100%+ NRR
- Take Command of Your Revenue Architecture
- Frequently Asked Questions

Churn solution that turns your customers right around.
Related Articles
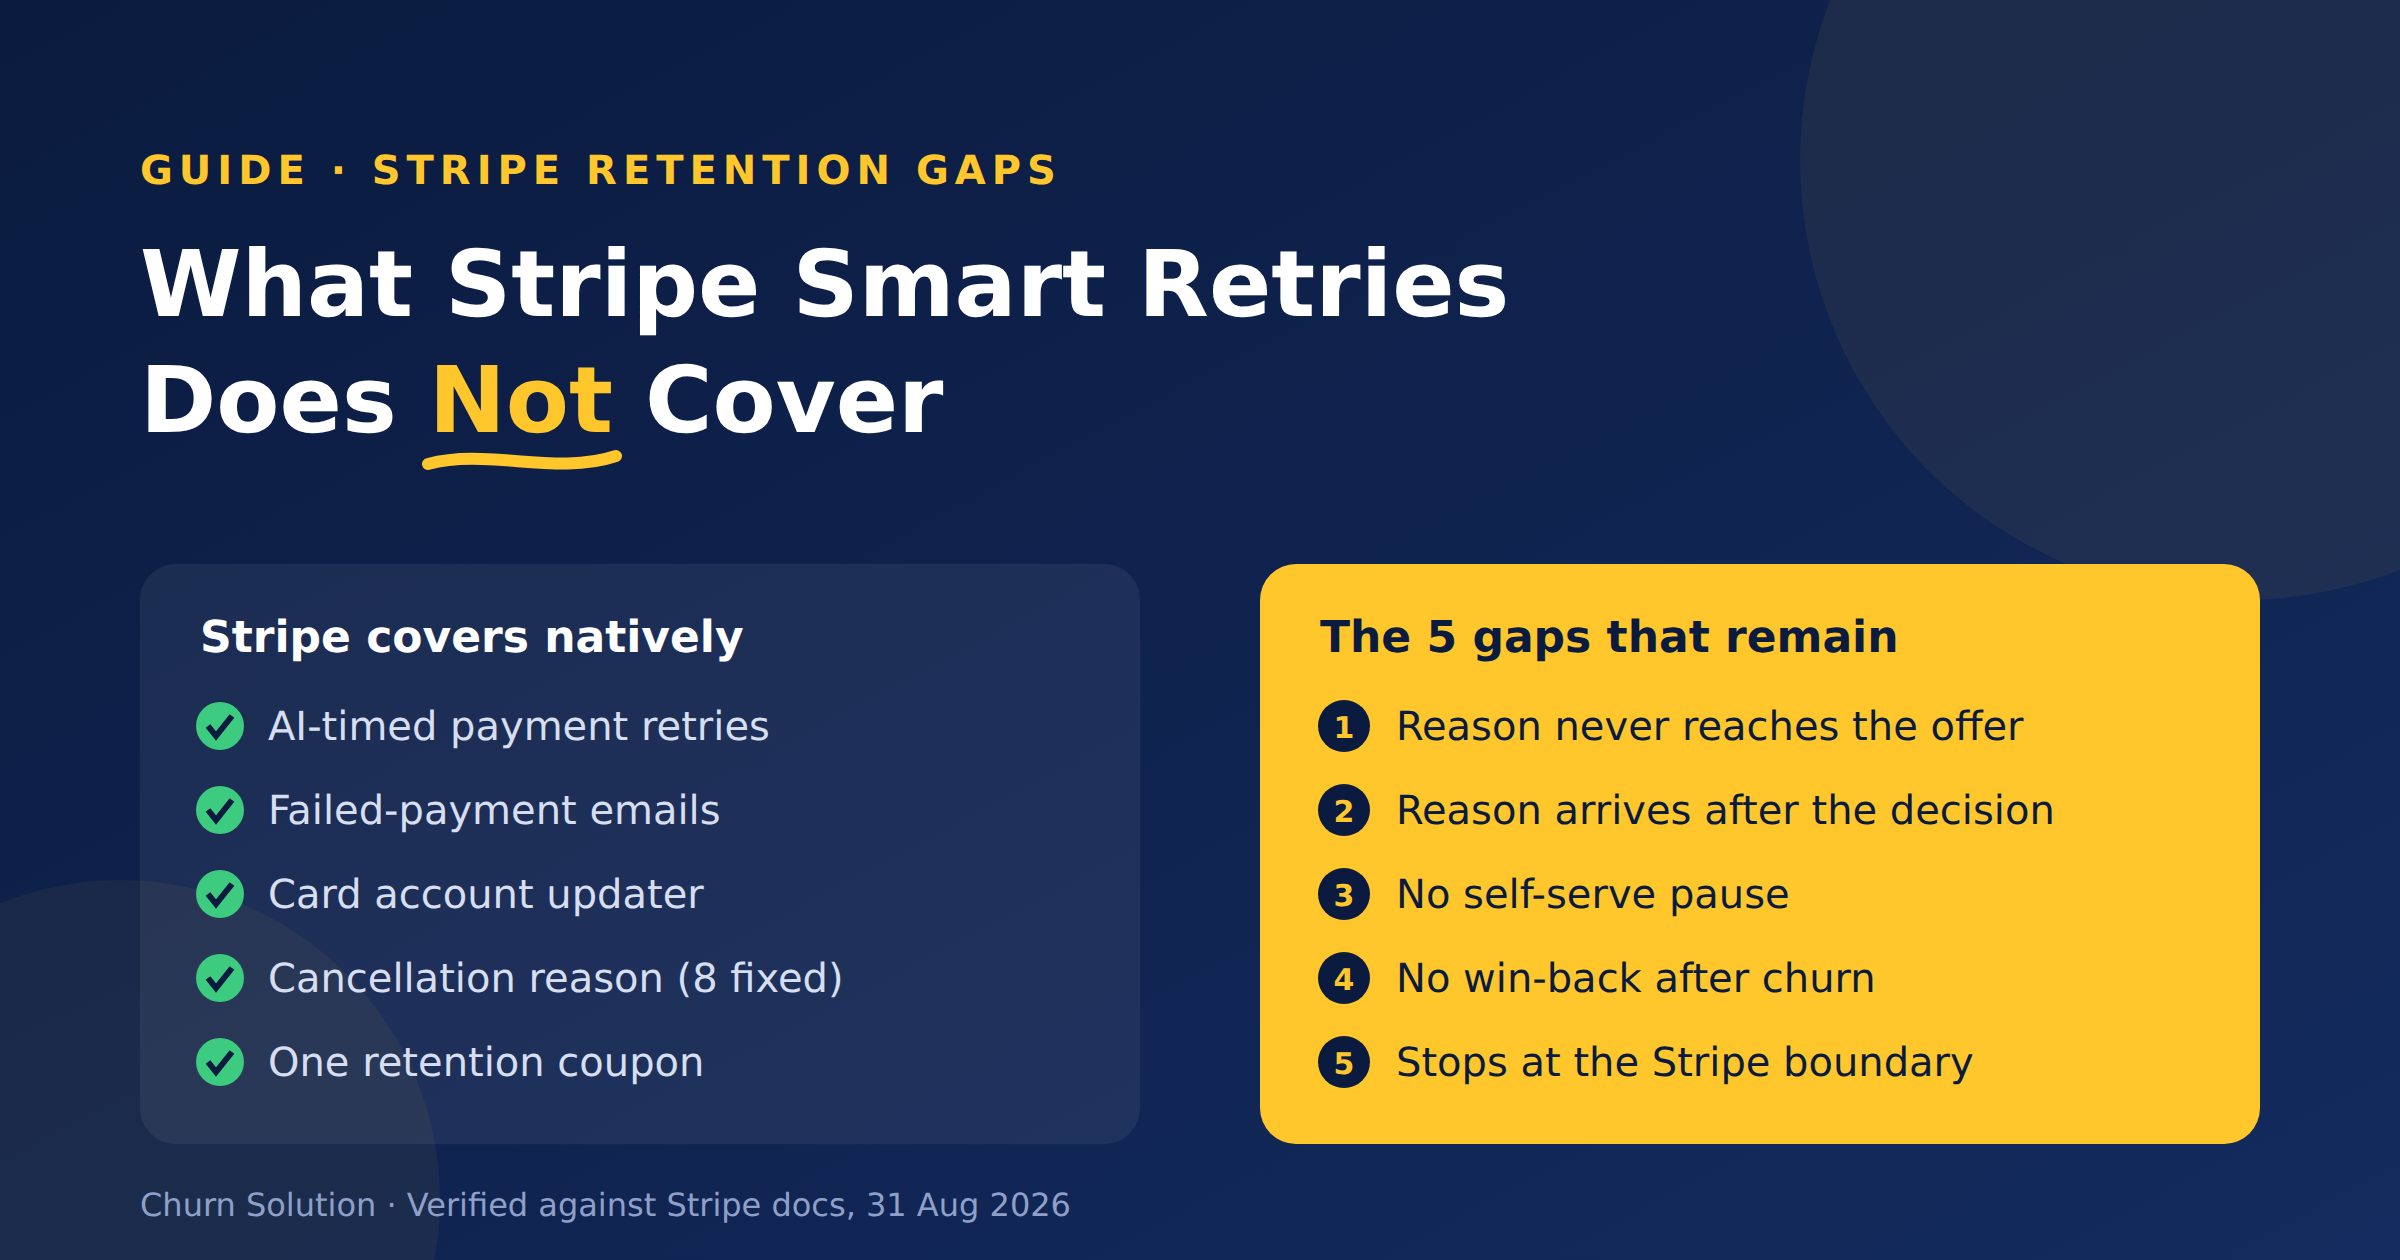
What Stripe Smart Retries Does Not Cover
Stripe Smart Retries recovers failed payments but doesn't run retention. Here are the five gaps that remain, sourced from Stripe's...


Membership Community Churn: The Members Who Quit Without Clicking Cancel
Quiet churn is the real leak: members who never clicked “cancel” at all. A card expires. A bank declines a...

Subscription Churn Dashboard: The 2026 Guide to Actionable Revenue Intelligence
Up to 40% of subscription churn is involuntary, meaning your customers aren't choosing to leave; they're being forced out by...